- Instantly extract effect sizes, F-ratios, and FDR-adjusted p-values from your models with the Calculate Effects Sizes extension, available now in the JMP Marketplace!
- New to JMP? Join us Sept. 23-24 for the Early User Edition of Discovery Summit, tailor-made for new users. Register now for free!
- Your voice matters! Tell us how you prefer to receive JMP updates, so we can tailor our communication to your needs. Take short survey.
- Subscribe to RSS Feed
- Mark Topic as New
- Mark Topic as Read
- Float this Topic for Current User
- Bookmark
- Subscribe
- Mute
- Printer Friendly Page
Discussions
Solve problems, and share tips and tricks with other JMP users.- JMP User Community
- :
- Discussions
- :
- Graph Builder - Custom Marker Colors Not Saving in Script

- Mark as New
- Bookmark
- Subscribe
- Mute
- Subscribe to RSS Feed
- Get Direct Link
- Report Inappropriate Content
Graph Builder - Custom Marker Colors Not Saving in Script
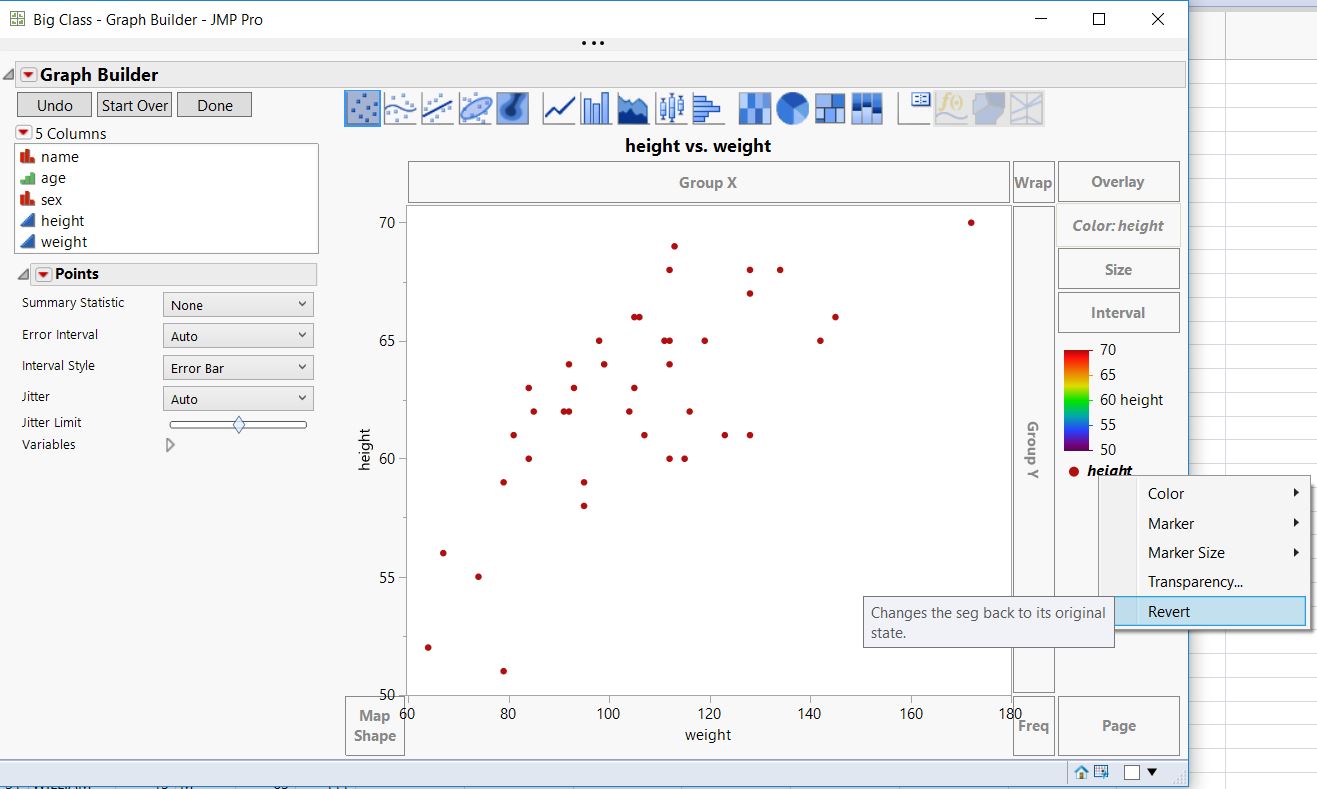
Hi there - the graph that a colleague of mine made originally had markers color coded by a continuous column (see "Original" image). When they save the script and re-run the script to re-create the graph, the color-coding goes away and all of the markers become maroon (see "After" image). Do you have any suggestions for how to keep the color-coding such that each time the graph script is run, the color coding stays? What could be the issue?
Original

-->After rerunning the script and despite saving the color scheme:
After


- Mark as New
- Bookmark
- Subscribe
- Mute
- Subscribe to RSS Feed
- Get Direct Link
- Report Inappropriate Content
回复: Graph Builder - Custom Marker Colors Not Saving in Script
Hi
我使用的是Big Class.jmp。用‘身高’和‘体重’作为Y和X。把‘身高’放入‘颜色’。
选择需要的色阶,然后将label中点的配置进行调整。(如图)
然后保存脚本就可以了。脚本中主要的区别是图中的点被定义的次数不同。
调整后的脚本如下:
Graph Builder(
	Size( 528, 456 ),
	Show Control Panel( 0 ),
	Variables( X( :weight ), Y( :height ), Color( :height ) ),
	Elements( Points( X, Y, Legend( 5 ) ) ),
	SendToReport(
		Dispatch(
			{},
			"400",
			ScaleBox,
			{Legend Model(
				5,
				Properties(
					0,
					{gradient( {Color Theme( "Spectral" )} )},
					Item ID( "height", 1 )
				)
			)}
		),
		Dispatch( {}, "400", LegendBox, {Set Title( "" )} )
	)
)
未做调整的脚本如下:
多了scatter plot开始时默认时的定义
Properties( 1, {Line Color( -11538191 ), Fill Color( -11538191 ), gradient( {Color Theme( "Spectral" )} )}, Item ID( "height", 2 ))
Graph Builder(
	Variables( X( :weight ), Y( :height ), Color( :height ) ),
	Elements( Points( X, Y, Legend( 9 ) ) ),
	SendToReport(
		Dispatch(
			{},
			"400",
			ScaleBox,
			{Legend Model(
				9,
				Properties(
					0,
					{gradient( {Color Theme( "Spectral" )} )},
					Item ID( "height", 1 )
				),
				Properties(
					1,
					{Line Color( -11538191 ), Fill Color( -11538191 ),
					gradient( {Color Theme( "Spectral" )} )},
					Item ID( "height", 2 )
				)
			)}
		)
	)
)
Recommended Articles
- © 2026 JMP Statistical Discovery LLC. All Rights Reserved.
- Terms of Use
- Privacy Statement
- Contact Us