- Subscribe to RSS Feed
- Mark Topic as New
- Mark Topic as Read
- Float this Topic for Current User
- Bookmark
- Subscribe
- Mute
- Printer Friendly Page
Discussions
Solve problems, and share tips and tricks with other JMP users.- JMP User Community
- :
- Discussions
- :
- Getting "Page By" and "Wrap By" to work together nicely?
- Mark as New
- Bookmark
- Subscribe
- Mute
- Subscribe to RSS Feed
- Get Direct Link
- Report Inappropriate Content
Getting "Page By" and "Wrap By" to work together nicely?
Say I have six data sets indexed as X_Y: e.g., [A_1, A_2, A_3, B_1, B_2, C_1]
If I want to page by X and wrap by Y, is there any way to do so in Graph Builder without having a bunch of empty plots (i.e., no empty space for B_3, no empty spaces for C_2 and C_3)? The desired format would be the first page would have three wrapped plots for A_1, A_2, and A_3, the second page would have only two wrapped plots for B_1 and B_2, and the third page would show only one plot (C_1).
That's the toy example, but more generally I often need to do this with time-sequence data. Maybe I have 20 different objects, some of which are measured just once and some of which could be measured 15 times. If I do "page by object", "wrap by measurement #", the pages for objects that were only measured once will be almost entirely empty space - fifteen plots will be displayed, but only one will be populated with data.
Ideally it would be great if I didn't even have to index the measurements 1-15, I would love to be able to say "page by object", "wrap by timestamp", and have Graph Builder notice that Object A was measured 4 times between June 1 10:30 and June 8 14:00, and so the page for Object A would display four plots.
Thanks for any help, and please let me know if anything is not clear in the question.
Accepted Solutions
- Mark as New
- Bookmark
- Subscribe
- Mute
- Subscribe to RSS Feed
- Get Direct Link
- Report Inappropriate Content
Re: Getting "Page By" and "Wrap By" to work together nicely?
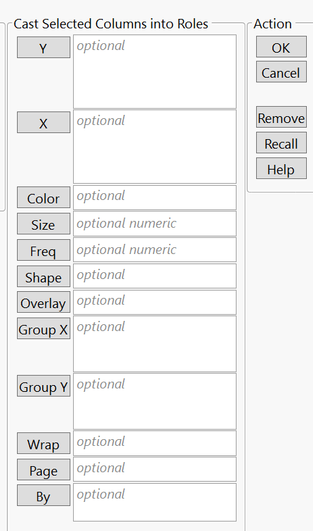
In the Graph Builder dialog button, there is an option to add a by variable in the launch window. When the by role is used instead of the page role, a separate instance of Graph Builder will be made for each level of the grouping variable. With the by option, those empty plots are no longer there.
The dialog button can be found here in Graph Builder.
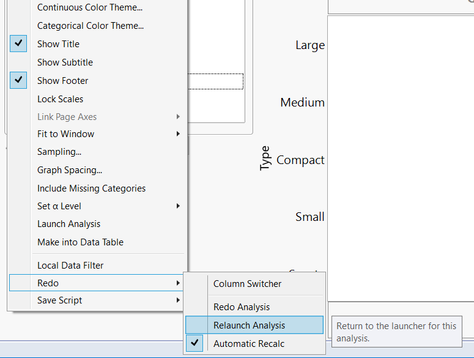
Or under the Red Triangle in Graph Builder under Redo and then Relaunch if you have already populated Graph Builder.
The dialog opens and you can place your page variable (X or Object in your example) into the by section instead.
To broadcast commands to all the graphs created using the by option, hold down the ctrl key before and while clicking.
-Olivia
- Mark as New
- Bookmark
- Subscribe
- Mute
- Subscribe to RSS Feed
- Get Direct Link
- Report Inappropriate Content
Re: Getting "Page By" and "Wrap By" to work together nicely?
Hi Olivia,
Thanks for the helpful response! You are right, "By" works better than "Page" for my application.
My only remaining issue is broadcasting the commands. When I create the graphs using the "By" role, even if I hold Ctrl key the entire time, changing one plot format only seems to change the selected plots - it does not propagate the changes to all graphs. For example, if I am using a line graph and want to change all displayed plots to row order, I tried doing hold Ctrl + right click line graph + click "Row order" + release Ctrl, but it only changes the active graph. (When using "Page" instead of "By", this procedure would broadcast the changes to all graphs.)
I am using JMP Pro 12.2.0.
- Mark as New
- Bookmark
- Subscribe
- Mute
- Subscribe to RSS Feed
- Get Direct Link
- Report Inappropriate Content
Re: Getting "Page By" and "Wrap By" to work together nicely?
I tested the ctrl option above when clicking the "done" button to get out of edit mode. The ctrl broadcast option is available for the buttons at the top such as "done" as well as the red triangle menu options. However, the options for each individual graph builder such as row order do not broadcast when using the "by" option.
-Olivia
- Mark as New
- Bookmark
- Subscribe
- Mute
- Subscribe to RSS Feed
- Get Direct Link
- Report Inappropriate Content
Re: Getting "Page By" and "Wrap By" to work together nicely?
Thanks for the update Olivia. It would be extremely useful to me if full broadcasting were implemented in a future version!
- Mark as New
- Bookmark
- Subscribe
- Mute
- Subscribe to RSS Feed
- Get Direct Link
- Report Inappropriate Content
Re: Getting "Page By" and "Wrap By" to work together nicely?
You should add this request to the JMP Wish List
- Mark as New
- Bookmark
- Subscribe
- Mute
- Subscribe to RSS Feed
- Get Direct Link
- Report Inappropriate Content
Re: Getting "Page By" and "Wrap By" to work together nicely?
OK, I have added a Wish List request here: https://community.jmp.com/t5/JMP-Wish-List/Add-ctrl-broadcast-option-when-using-quot-By-quot-in-Grap...
Recommended Articles
- © 2026 JMP Statistical Discovery LLC. All Rights Reserved.
- Terms of Use
- Privacy Statement
- Contact Us


