- Subscribe to RSS Feed
- Mark Topic as New
- Mark Topic as Read
- Float this Topic for Current User
- Bookmark
- Subscribe
- Mute
- Printer Friendly Page
Discussions
Solve problems, and share tips and tricks with other JMP users.- JMP User Community
- :
- Discussions
- :
- Re: Get count for grouping (panels) in graph builder to check the visualisation ...
- Mark as New
- Bookmark
- Subscribe
- Mute
- Subscribe to RSS Feed
- Get Direct Link
- Report Inappropriate Content
Get count for grouping (panels) in graph builder to check the visualisation is sensible
So I have written a bit of JSL which is able to take a data table and make suggestions of graphs. It checks the number of unique values, column data type and column name to assess which graph would be most appropriate.
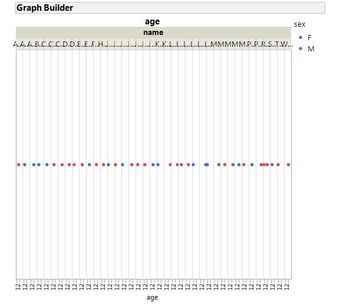
One issue I am having is when it uses Page, Group X, Group Y and/or Wrap and there aren't many data points in the resulting panels. Below is a silly example using Big Class. Clearly name is a poor grouping variable because each panel of the graph only contains one point.
Once my code has choosen a potential visualisation what would be the best way to check that the layout will not contain mostly panels which are data sparse/empty?
- Since I know how my variables are related I can build a table using tabulate, create a hidden data table, create a matrix and then check the sparsity of the matrix. This seems long winded.
- I need count which I don't think is possible using the JSL summarise() function (in JMP 12) which doesn't create a table.
- Is there an elegant way to build the count matrix?
- Typically the code suggests three graphs for each item in the most numerous list (X, Y or Legend), so I want to avoid creating tables if possible.
Thanks,
Stephen
- Mark as New
- Bookmark
- Subscribe
- Mute
- Subscribe to RSS Feed
- Get Direct Link
- Report Inappropriate Content
Re: Get count for grouping (panels) in graph builder to check the visualisation is sensible
Summarize is the way to go. It can not do counts for character columns, but it can get the grouping values from which you can get the counts. See the script below
Names Default To Here( 1 );
dt = Open( "$SAMPLE_DATA\big class.jmp" );
// Numeric Column
dt = Open( "$SAMPLE_DATA\big class.jmp" );
Summarize( dt, bygroup = by( :age ), counts = Count( :age ) );
Show( "Numeric Column", bygroup, counts );

// Character Column
Summarize( dt, bygroup = by( :sex ) );
counts = {};
For( i = 1, i <= N Items( bygroup ), i++,
	Insert Into( counts, N Rows( dt << get rows where( :sex == bygroup[i] ) ) )
);
Show( "Character Column", bygroup, counts );- Mark as New
- Bookmark
- Subscribe
- Mute
- Subscribe to RSS Feed
- Get Direct Link
- Report Inappropriate Content
Re: Get count for grouping (panels) in graph builder to check the visualisation is sensible
Thanks for that example. If I have a Group Y and a Group X (an potentially X as well) all as character then I need to nest three for loops? This rapidly becomes a way to tie up JMP in loops as the data tables are of an unknown size (Potentially a user could request 30 graphs all of which need the panel matrix calculating - I have capped the program to display only the first 30 suggestions).
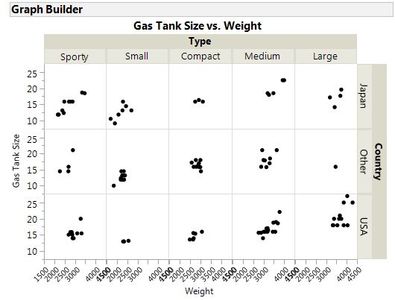
Perhaps this is a better example using cars physical data, what I was hoping for was a 3x5 matrix or a 15 item list.
Am I best recoding the character columns as Numeric in order to make the best use of summarise()? Is likely to be quicker/tidier than for loops?
- Mark as New
- Bookmark
- Subscribe
- Mute
- Subscribe to RSS Feed
- Get Direct Link
- Report Inappropriate Content
Re: Get count for grouping (panels) in graph builder to check the visualisation is sensible
If all of your grouping variables were numeric, it would be faster, because the summarize would be able to make quick work of the counting. But that is very restrictive to the data and/or the user. You could convert the summarize function calls to "Summary" platforms, and create tables which can handle both numeric and character columns. You could do some timing tests to see if that will work.
Names Default To Here( 1 );
dt = Open( "$SAMPLE_DATA\car physical data.jmp" );

dtsumm=dt << Summary(private,
	Group( :type),
	N( :type ),
	Freq( "None" ),
	Weight( "None" )
);

show(dtsumm:type<<get values);
close(dtsumm,nosave);

dtsumm=dt << Summary(private,
	Group( :country),
	N( :country),
	Freq( "None" ),
	Weight( "None" )
);

show(dtsumm:country<<get values);
close(dtsumm,nosave);- Mark as New
- Bookmark
- Subscribe
- Mute
- Subscribe to RSS Feed
- Get Direct Link
- Report Inappropriate Content
Re: Get count for grouping (panels) in graph builder to check the visualisation is sensible
Turns out there is a JMP add-in which can convert all the character columns to numeric. Thanks to @M_Anderson for pointing it out.
This makes it really easy to use summarise().
Recommended Articles
- © 2026 JMP Statistical Discovery LLC. All Rights Reserved.
- Terms of Use
- Privacy Statement
- Contact Us


