- New to JMP? Join us Sept. 23-24 for the Early User Edition of Discovery Summit, tailor-made for new users. Register now for free!
- Your voice matters! Tell us how you prefer to receive JMP updates, so we can tailor our communication to your needs. Take short survey.
- See how to access JMP Marketplace - and - find, create & share add-ins to extend your JMP. Watch video.
- Subscribe to RSS Feed
- Mark Topic as New
- Mark Topic as Read
- Float this Topic for Current User
- Bookmark
- Subscribe
- Mute
- Printer Friendly Page
Discussions
Solve problems, and share tips and tricks with other JMP users.- JMP User Community
- :
- Discussions
- :
- Gardner-Altman Graph

- Mark as New
- Bookmark
- Subscribe
- Mute
- Subscribe to RSS Feed
- Get Direct Link
- Report Inappropriate Content
Gardner-Altman Graph
Dear all,
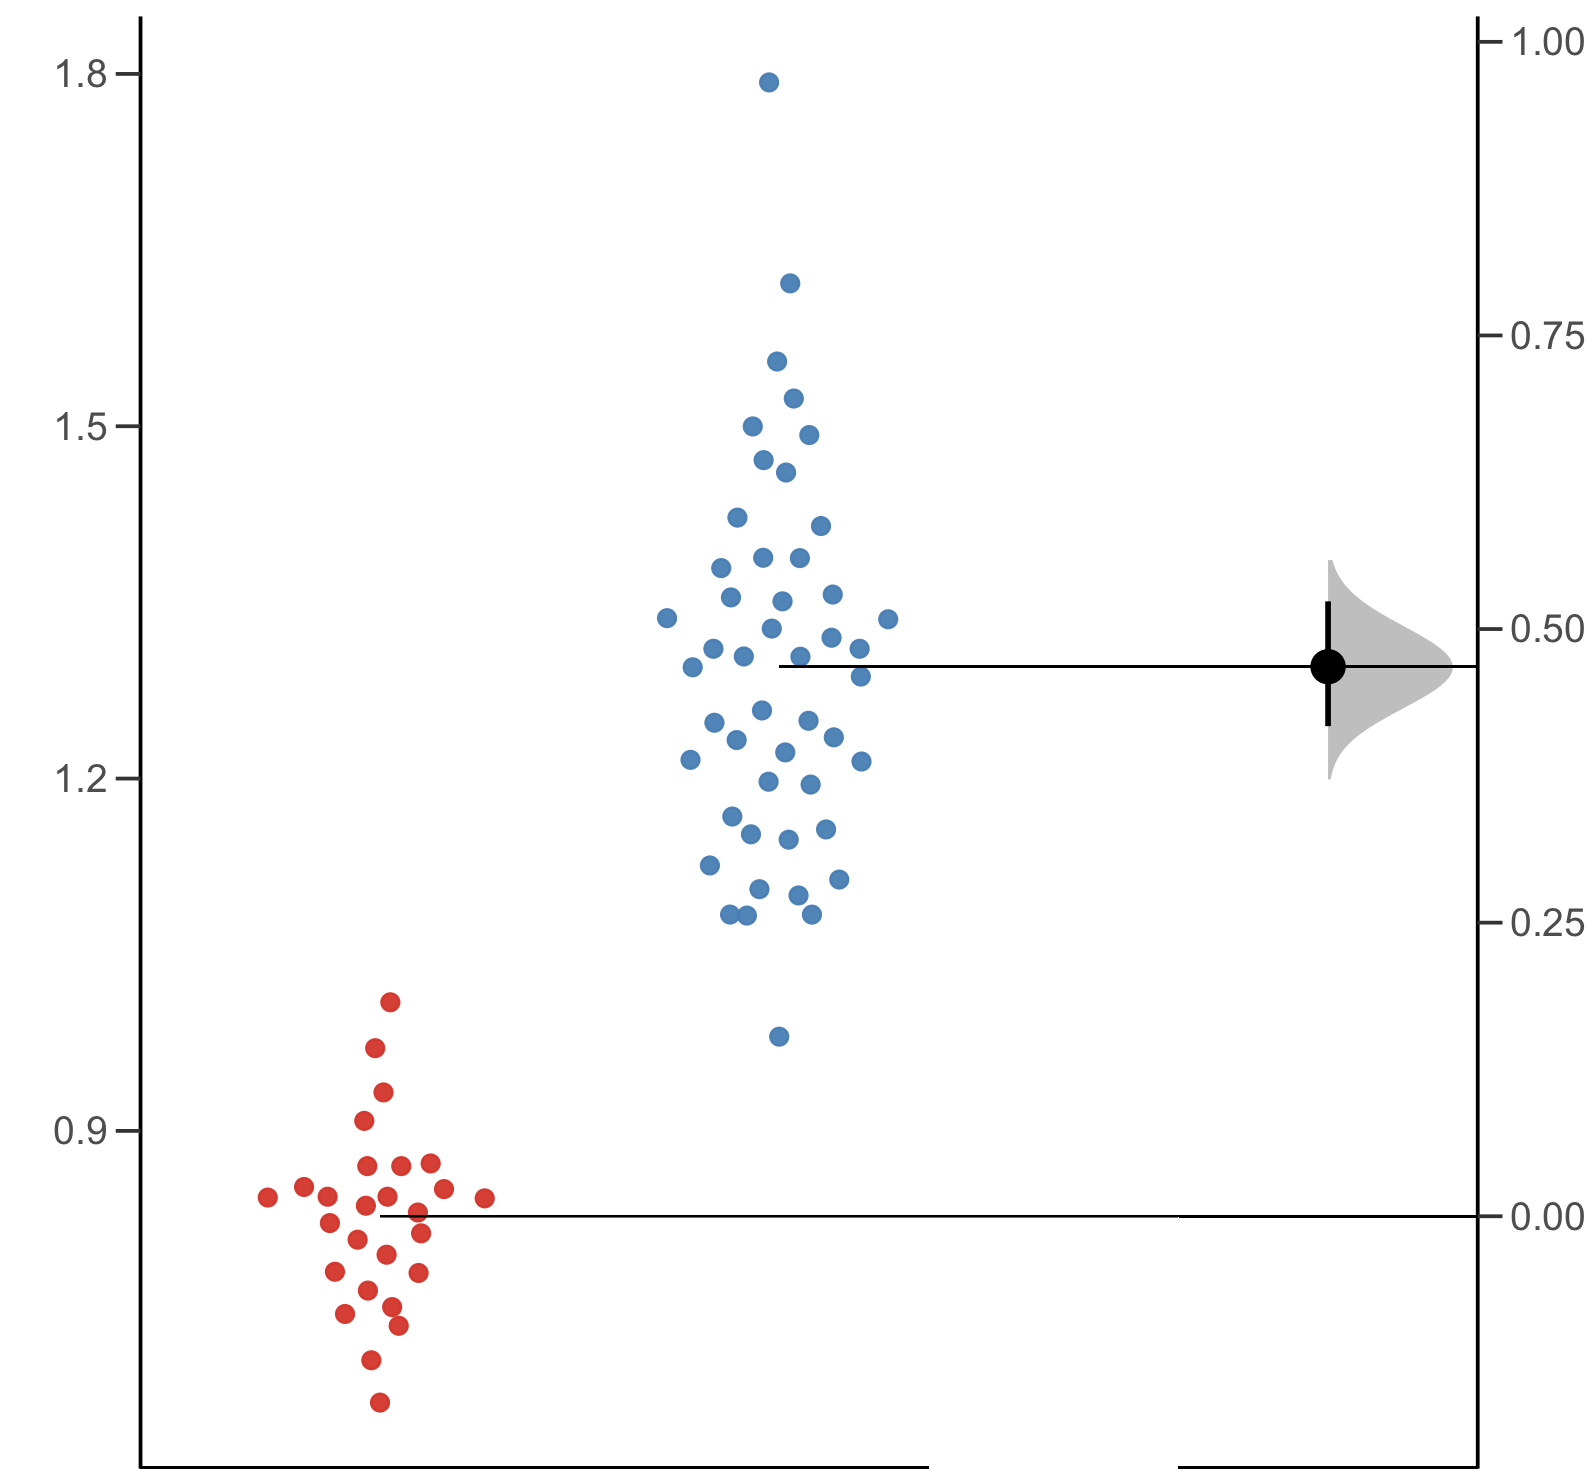
would anyone of you know how to make the graph as in object?
On the internet I searched and found that it can be done with R (I attach photos), but it is a graph that could be improved, for example by adding a box-plot and a half-violin plot that would give more information in addition to the dot plot.
The result is an excellent inferential tool.
Thanks you very much.
Giuseppe


- Mark as New
- Bookmark
- Subscribe
- Mute
- Subscribe to RSS Feed
- Get Direct Link
- Report Inappropriate Content
Re: Gardner-Altman Graph
How is this question different from your previous Discussion question?
Box-plot + dot plot + half violin plot
If you are looking for the specific Gardner-Altman Graph, then it is available through the JMP/R capability in JMP. Look in the Scripting Index under Extending JMP.
- Mark as New
- Bookmark
- Subscribe
- Mute
- Subscribe to RSS Feed
- Get Direct Link
- Report Inappropriate Content
Re: Gardner-Altman Graph
Dear Txnelson,
since I don't like the Gardner-Altman graph obtained with R I would have liked to have made it with JMP which has more attractive graphics.
Then the graph with the points alone is not very informative; while with a box-plot and a half-violin plot the information is greater. I would say that in part the previous post is similar to this post, only the inferential part linked to Gardner-Altman would be missing.
I am attaching the program R:
install.packages("magrittr")
library(dabestr)

pr = read.xls("...directory of the DB", sheet=...)
bootstrap <- dabest(pr,
                   group,
                    variable,
                  idx = c("group1", "group2"),
                   paired = FALSE)
bootstrap_diff <- mean_diff(bootstrap)
plot(bootstrap_diff)
This program creates the graphic of the photo, to which it would be interesting to add the box-plot and the half-violin plot.
In Scripting Index under Extending JMP I did not find this plot.
Thank you very much
Giuseppe
- Mark as New
- Bookmark
- Subscribe
- Mute
- Subscribe to RSS Feed
- Get Direct Link
- Report Inappropriate Content
Re: Gardner-Altman Graph
I would not expect to see your Gardner-Alman Chart in the JMP R extension documentation. The documentation describes the JMP R interface, and is not intended as an R code repository. My guess is that you will not get an individual to create the chart you want and that you will need to start down the path of writing your own code to create the chart. I also think you need to add your request to the JMP Wish List, so the chart(s) will be evalueated for future addition into JMP.
- Mark as New
- Bookmark
- Subscribe
- Mute
- Subscribe to RSS Feed
- Get Direct Link
- Report Inappropriate Content
Re: Gardner-Altman Graph
Dear Txnelson,
I will follow your precious advice.
These graphs are a valuable tool for statistical inference and being able to make them with JMP would be points more for this software and its users.
Thanks you
Giuseppe
Recommended Articles
- © 2026 JMP Statistical Discovery LLC. All Rights Reserved.
- Terms of Use
- Privacy Statement
- Contact Us