- Don’t miss your chance to experience Discovery Summit Europe at our best available rate! Early bird registration through 31 Oct.
- Graph Builder Toolbar streamlines interactive graphing. Creates shortcuts on Report and GraphBuilder Helpers toolbars. Download and install the extension.
- Subscribe to RSS Feed
- Mark Topic as New
- Mark Topic as Read
- Float this Topic for Current User
- Bookmark
- Subscribe
- Mute
- Printer Friendly Page
Discussions
Solve problems, and share tips and tricks with other JMP users.- User Community
- :
- Discussions
- :
- Re: Extending the Linear regression

- Mark as New
- Bookmark
- Subscribe
- Mute
- Subscribe to RSS Feed
- Get Direct Link
- Report Inappropriate Content
Extending the Linear regression
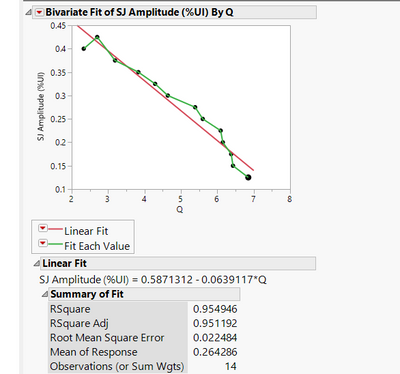
Hi,
JMP has constitute the linear regression formula. In this case Q is the slope. I wanted to see the Q=7 and Q=8 demonstrated in the line plot about. How do I do that in jmp. Otherwise I need to calculate and put in excel or data table,
Accepted Solutions

- Mark as New
- Bookmark
- Subscribe
- Mute
- Subscribe to RSS Feed
- Get Direct Link
- Report Inappropriate Content
Re: Extending the Linear regression
Create a new column by saving the prediction formula. Then in the Q column enter desired values for Q and the values for the prediction will populate in the data table.


- Mark as New
- Bookmark
- Subscribe
- Mute
- Subscribe to RSS Feed
- Get Direct Link
- Report Inappropriate Content
Re: Extending the Linear regression
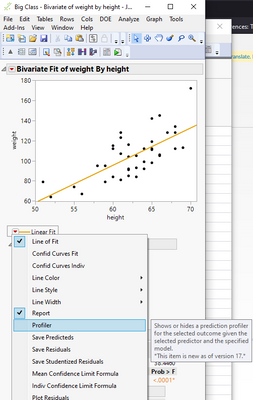
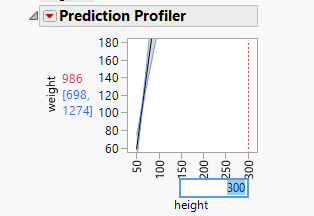
If you have JMP17 you might be able to launch profiler from red triangle next to Linear Fit
- Mark as New
- Bookmark
- Subscribe
- Mute
- Subscribe to RSS Feed
- Get Direct Link
- Report Inappropriate Content
Re: Extending the Linear regression
Create a new column by saving the prediction formula. Then in the Q column enter desired values for Q and the values for the prediction will populate in the data table.
- Mark as New
- Bookmark
- Subscribe
- Mute
- Subscribe to RSS Feed
- Get Direct Link
- Report Inappropriate Content
Re: Extending the Linear regression
If you have JMP17 you might be able to launch profiler from red triangle next to Linear Fit
Recommended Articles
- © 2026 JMP Statistical Discovery LLC. All Rights Reserved.
- Terms of Use
- Privacy Statement
- Contact Us