- New to JMP? Join us Sept. 23-24 for the Early User Edition of Discovery Summit, tailor-made for new users. Register now for free!
- Subscribe to RSS Feed
- Mark Topic as New
- Mark Topic as Read
- Float this Topic for Current User
- Bookmark
- Subscribe
- Mute
- Printer Friendly Page
Discussions
Solve problems, and share tips and tricks with other JMP users.- JMP User Community
- :
- Discussions
- :
- Re: Export all control charts from By column on one page for export to powerpoin...

- Mark as New
- Bookmark
- Subscribe
- Mute
- Subscribe to RSS Feed
- Get Direct Link
- Report Inappropriate Content
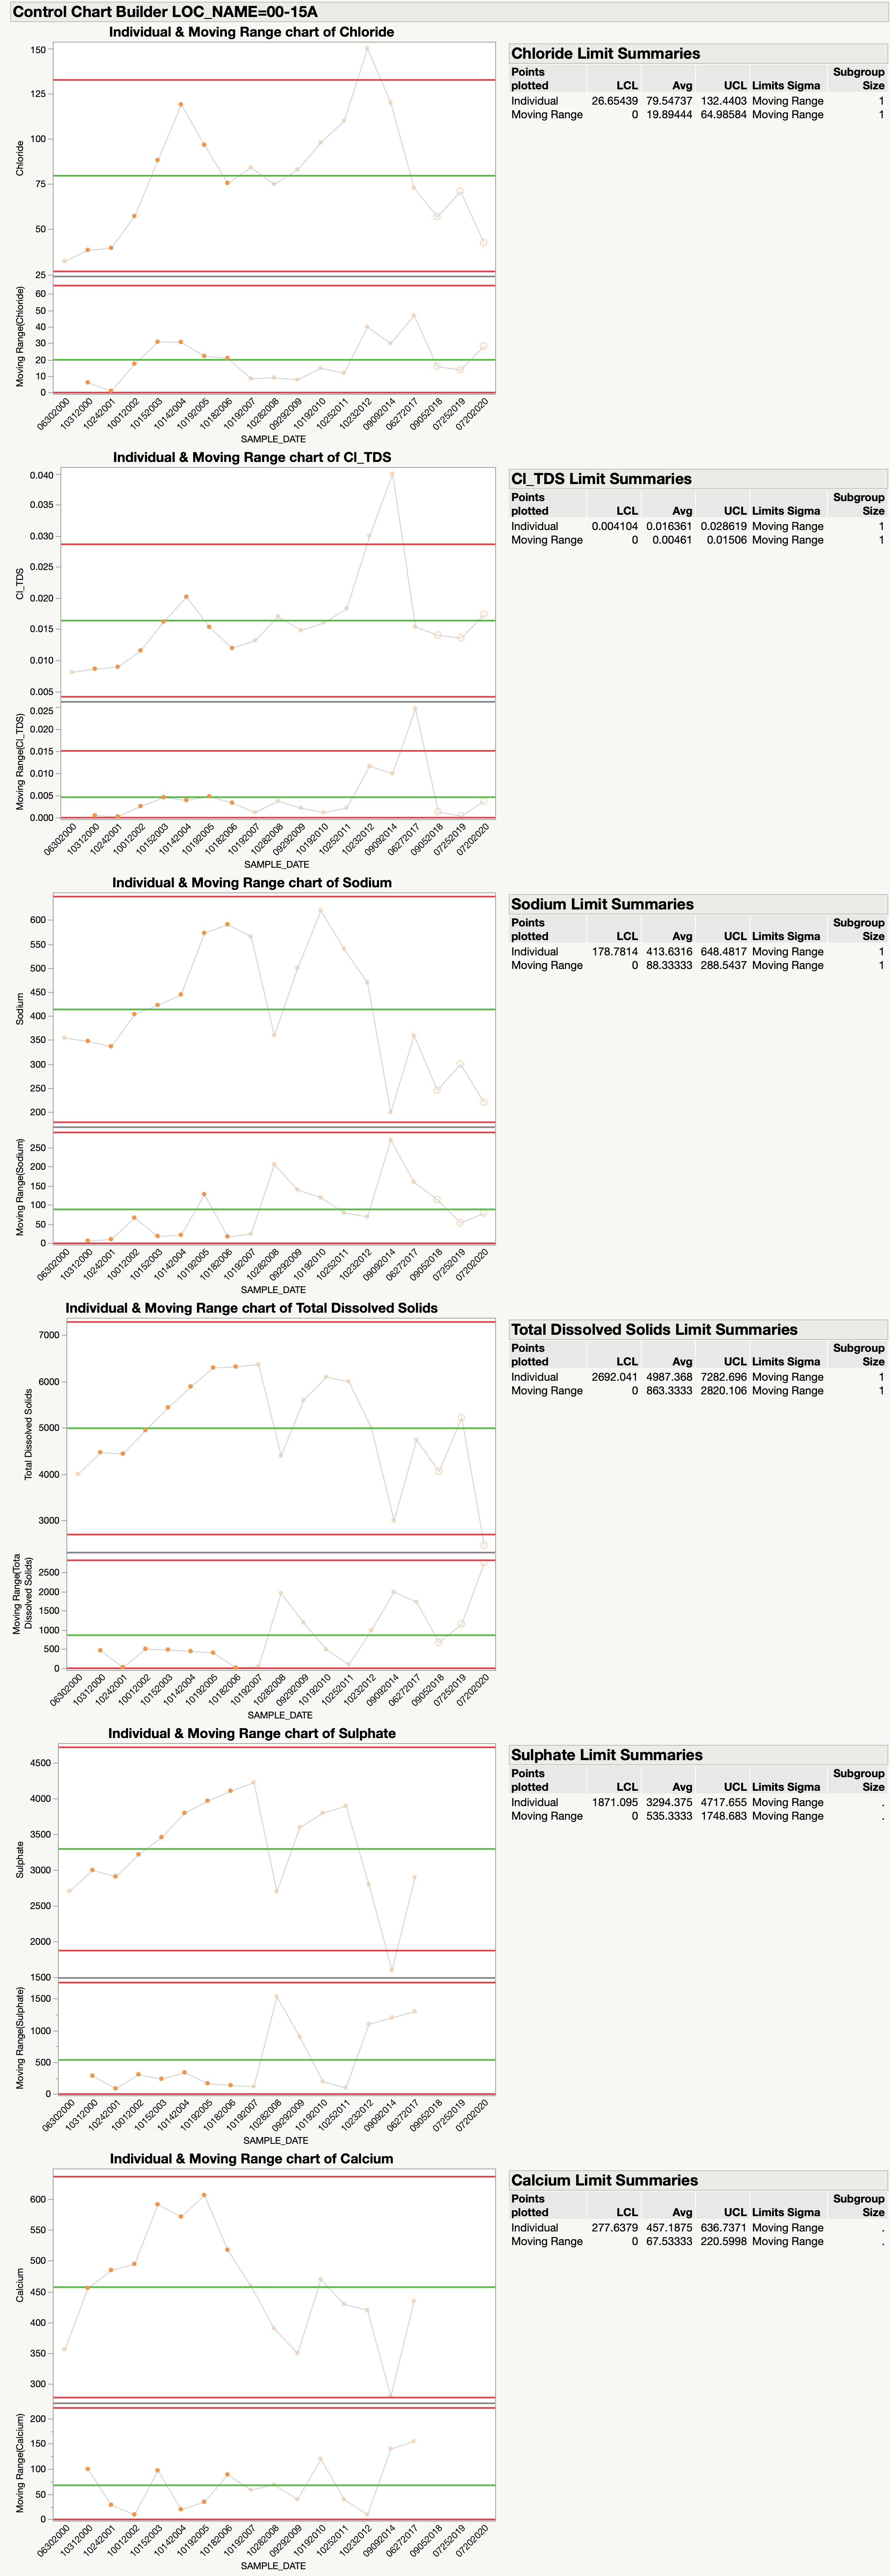
Export all control charts from By column on one page for export to powerpoint
Hello,
I have a script that I use to make 6 control charts for 20 separate groundwater monitoring wells using the By portion in the script. I would like to add on to the end of the script so I can print the 6 control charts for each separate monitoring location on one page in a powerpoint presentation Result in a powerpoint presentation that is 20 pages long, with 6 graphs on each page. I'm looking for some advice on where to start for this task? Here is the script I'm using to make the charts:
Control Chart Builder(
	Show Capability( 0 ),
	Variables(
		Subgroup( :SAMPLE_DATE ),
		Y(
			:Chloride,
			:Cl_TDS,
			:Sodium,
			:Total Dissolved Solids,
			:Sulphate,
			:Calcium
		),

	),
	By(:LOC_NAME)
);
Thank you!
Accepted Solutions

- Mark as New
- Bookmark
- Subscribe
- Mute
- Subscribe to RSS Feed
- Get Direct Link
- Report Inappropriate Content
Re: Export all control charts from By column on one page for export to powerpoint
Below is a script that creates the PowerPoint output from your Example data table

Names Default To Here( 1 );
dt = Current Data Table();

// Get a list of the LOC_Name's that are in the data
Summarize( dt, bygroup = by( :LOC_Name ) );

// Create a display window to put the graphs into
Nw = New Window( "Control Charts" );

// Loop across all of the LOC_Name's creating the six control
// charts
For( i = 1, i <= N Items( bygroup ), i++,

	// Create the Outline Box to hold the 6 charts
	ob = Outline Box( "Control Charts for LOC_Name=" || byGroup[i] );

	// Create a display box of three objects wide
	// With the 6 control charts, it will make it a
	// 2 row 3 column output
	lub = Lineup Box( N Col( 3 ) );

	// Create the 6 charts
	ccb = dt << Control Chart Builder( invisible,
		Show Capability( 0 ),
		Show control panel( 0 ),
		Variables(
			Subgroup( :SAMPLE_DATE ),
			Y(
				:Chloride,
				:Cl_TDS,
				:Sodium,
				:Total Dissolved Solids,
				:Sulphate,
				:Calcium
			)
		),
		show limit summaries( 0 ),
		where( :loc_name == Eval( bygroup[i] ) )
	);

	// Loop across the output pulling out the 6 Picture Boxes
	// that contains the desired output for each control chart
	// and add them to the Lineup Box
	For( k = 1, k <= 6, k++,
		lub << append( Report( ccb )[Picture Box( i )] )
	);

	// Close the no longer needed Control Chart Builder window
	Report( ccb ) << close window;

	// Add the contents of the Line Up Box to the Outline Box
	// but make it a single object so when saved to pptx it will
	// be treated as a single graph
	ob << append( lub << get picture );

	// Add the current outline box to the display window
	nw << append( ob );

);

// Save the graphs to PowerPoint
nw << save presentation( "$TEMP/myppt.pptx" );

// Display the PowerPoint output
Open( "$TEMP/myppt.pptx" );
Please take the time to study the script so you understand the approach I took, so you can make any adjustments needed. The section in the Scripting Guide on Display Trees will give you the background on how I picked apart the output, and built it back into a new display format.

- Mark as New
- Bookmark
- Subscribe
- Mute
- Subscribe to RSS Feed
- Get Direct Link
- Report Inappropriate Content
Re: Export all control charts from By column on one page for export to powerpoint
Hi,
I recorded a Mastering JMP session a few months ago in which I demonstrate how to automatically save reports to PowerPoint (Mastering JMP Sharing Your Results, starting at 33:30). This might be a good place to start. Please take a look and let me know if this points you in the right direction.
- Mark as New
- Bookmark
- Subscribe
- Mute
- Subscribe to RSS Feed
- Get Direct Link
- Report Inappropriate Content
Re: Export all control charts from By column on one page for export to powerpoint
Hi!
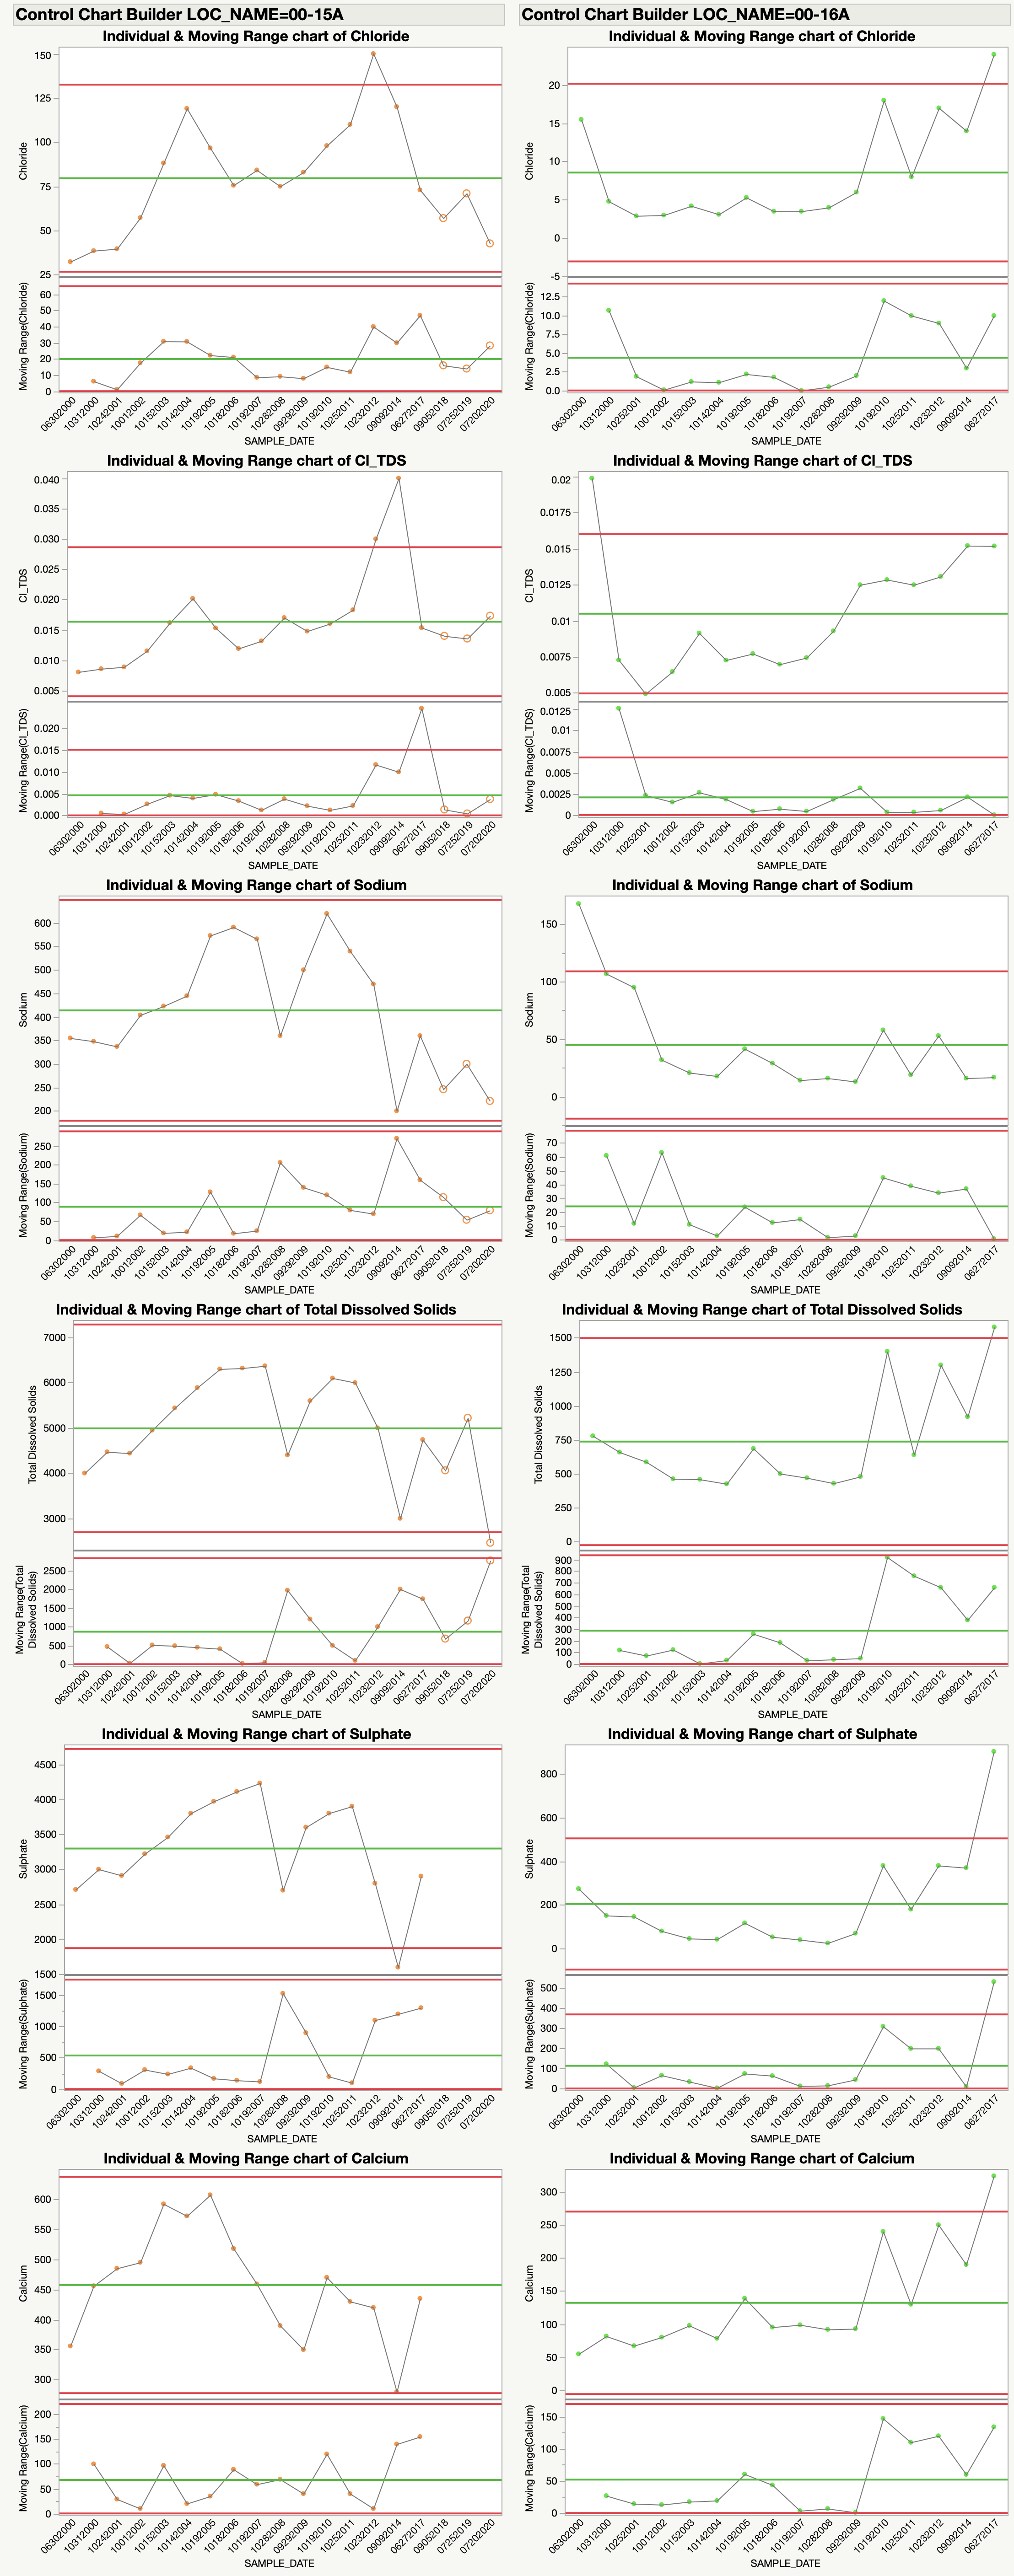
Thank you for your reply. I watched the video and it gave me the right info for putting the control charts in powerpoint and having them update automatically. That is definitely helpful. I have now added on to my script to save each set of my control charts as a jpg in a specific folder, and I will insert those into powerpoint as you said (with a link). However, my last piece of the puzzle involves arranging the graphs in my jpgs three graphs across and two down. Currently they are exporting 6 down, which doesn't look nice on a powerpoint slide. See attached picture.
Thanks for your help!
ccb = dt << Control Chart Builder(
	Show Capability( 0 ),
	Variables(
		Subgroup( :SAMPLE_DATE ),
		Y(
			:Chloride,
			:Cl_TDS,
			:Sodium,
			:Total Dissolved Solids,
			:Sulphate,
			:Calcium
		),

	),
		SendToReport(
		Dispatch( {}, "Chloride Limit Summaries", OutlineBox, {Close( 1 )} ),
		Dispatch( {}, "Cl_TDS Limit Summaries", OutlineBox, {Close( 1 )} ),
		Dispatch( {}, "Sodium Limit Summaries", OutlineBox, {Close( 1 )} ),
		Dispatch( {},
			"Total Dissolved Solids Limit Summaries",
			OutlineBox,
			{Close( 1 )}
		),
		Dispatch( {}, "Sulphate Limit Summaries", OutlineBox, {Close( 1 )} ),
		Dispatch( {}, "Calcium Limit Summaries", OutlineBox, {Close( 1 )} )
	),
	By(:LOC_NAME)
);

for(c=1, c<=NItems(ccb), c++,

	thisrep = Report(ccb[c]);

	firstOB = thisrep[OutlineBox(1)];

	thistitle = firstOB << getTitle;

	firstOB << save picture ("desktop/"||thistitle);
);- Mark as New
- Bookmark
- Subscribe
- Mute
- Subscribe to RSS Feed
- Get Direct Link
- Report Inappropriate Content
Re: Export all control charts from By column on one page for export to powerpoint
Here is one of the methods that I use to create multiple columns of output
Names Default To Here( 1 );
dt = Open( "$SAMPLE_DATA/big class.jmp" );

Nw = New Window( "Control Charts",
	Lineup Box( N Col( 2 ),
		Control Chart Builder(
			Show Capability( 0 ),
			Variables( Y( :height, :weight ) ),
			by( :age )
		)
	)
);- Mark as New
- Bookmark
- Subscribe
- Mute
- Subscribe to RSS Feed
- Get Direct Link
- Report Inappropriate Content
Re: Export all control charts from By column on one page for export to powerpoint
Hello,
Thank you for the idea. I changed the script a bit to include a Lineup box. At first I tried with multiple unique names ine the 'by' column. However it was putting a different sample in the second column, rather than splitting up the 6 graphs for each unique name into 2 columns of three. See attached photo.
So I tried again using only one unique value to see if it would split the six graphs into 2 columns and it exported the one unique value in a column of six graphs. It still didn't separate into 2 columns. What am I doing wrong?
Here's a portion of the script.
Nw = New Window( "Control Charts",
	Lineup Box( N Col( 3 ),
		Control Chart Builder(
			Show Capability( 0 ),
	Variables(
		Subgroup( :SAMPLE_DATE ),
		Y(
			:Chloride,
			:Cl_TDS,
			:Sodium,
			:Total Dissolved Solids,
			:Sulphate,
			:Calcium
		),

	),
		SendToReport(
		Dispatch( {}, "Chloride Limit Summaries", OutlineBox, {Close( 1 )} ),
		Dispatch( {}, "Cl_TDS Limit Summaries", OutlineBox, {Close( 1 )} ),
		Dispatch( {}, "Sodium Limit Summaries", OutlineBox, {Close( 1 )} ),
		Dispatch( {},
			"Total Dissolved Solids Limit Summaries",
			OutlineBox,
			{Close( 1 )}
		),
		Dispatch( {}, "Sulphate Limit Summaries", OutlineBox, {Close( 1 )} ),
		Dispatch( {}, "Calcium Limit Summaries", OutlineBox, {Close( 1 )} )
	),by(:LOC_NAME);
);

);
);
I've also included an example of my dataset if that helps.
Thank you for your help.
- Mark as New
- Bookmark
- Subscribe
- Mute
- Subscribe to RSS Feed
- Get Direct Link
- Report Inappropriate Content
Re: Export all control charts from By column on one page for export to powerpoint
Is this what you are looking for?

Names Default To Here( 1 );
dt = Current Data Table();

Summarize( dt, bygroup = by( :LOC_Name ) );

Nw = New Window( "Control Charts", lb = Lineup Box( N Col( 2 ) ) );


For( i = 1, i <= N Items( bygroup ), i++,
	vlb = V List Box(
		dt << Control Chart Builder(
			Show Capability( 0 ),
			Show control panel( 0 ),
			Variables(
				Subgroup( :SAMPLE_DATE ),
				Y( :Chloride, :Cl_TDS, :Sodium, :Total Dissolved Solids, :Sulphate, :Calcium )
			),
			show limit summaries( 0 ),
			where( :loc_name == Eval( bygroup[i] ) )
		)
	);
	lb << append( vlb );
);- Mark as New
- Bookmark
- Subscribe
- Mute
- Subscribe to RSS Feed
- Get Direct Link
- Report Inappropriate Content
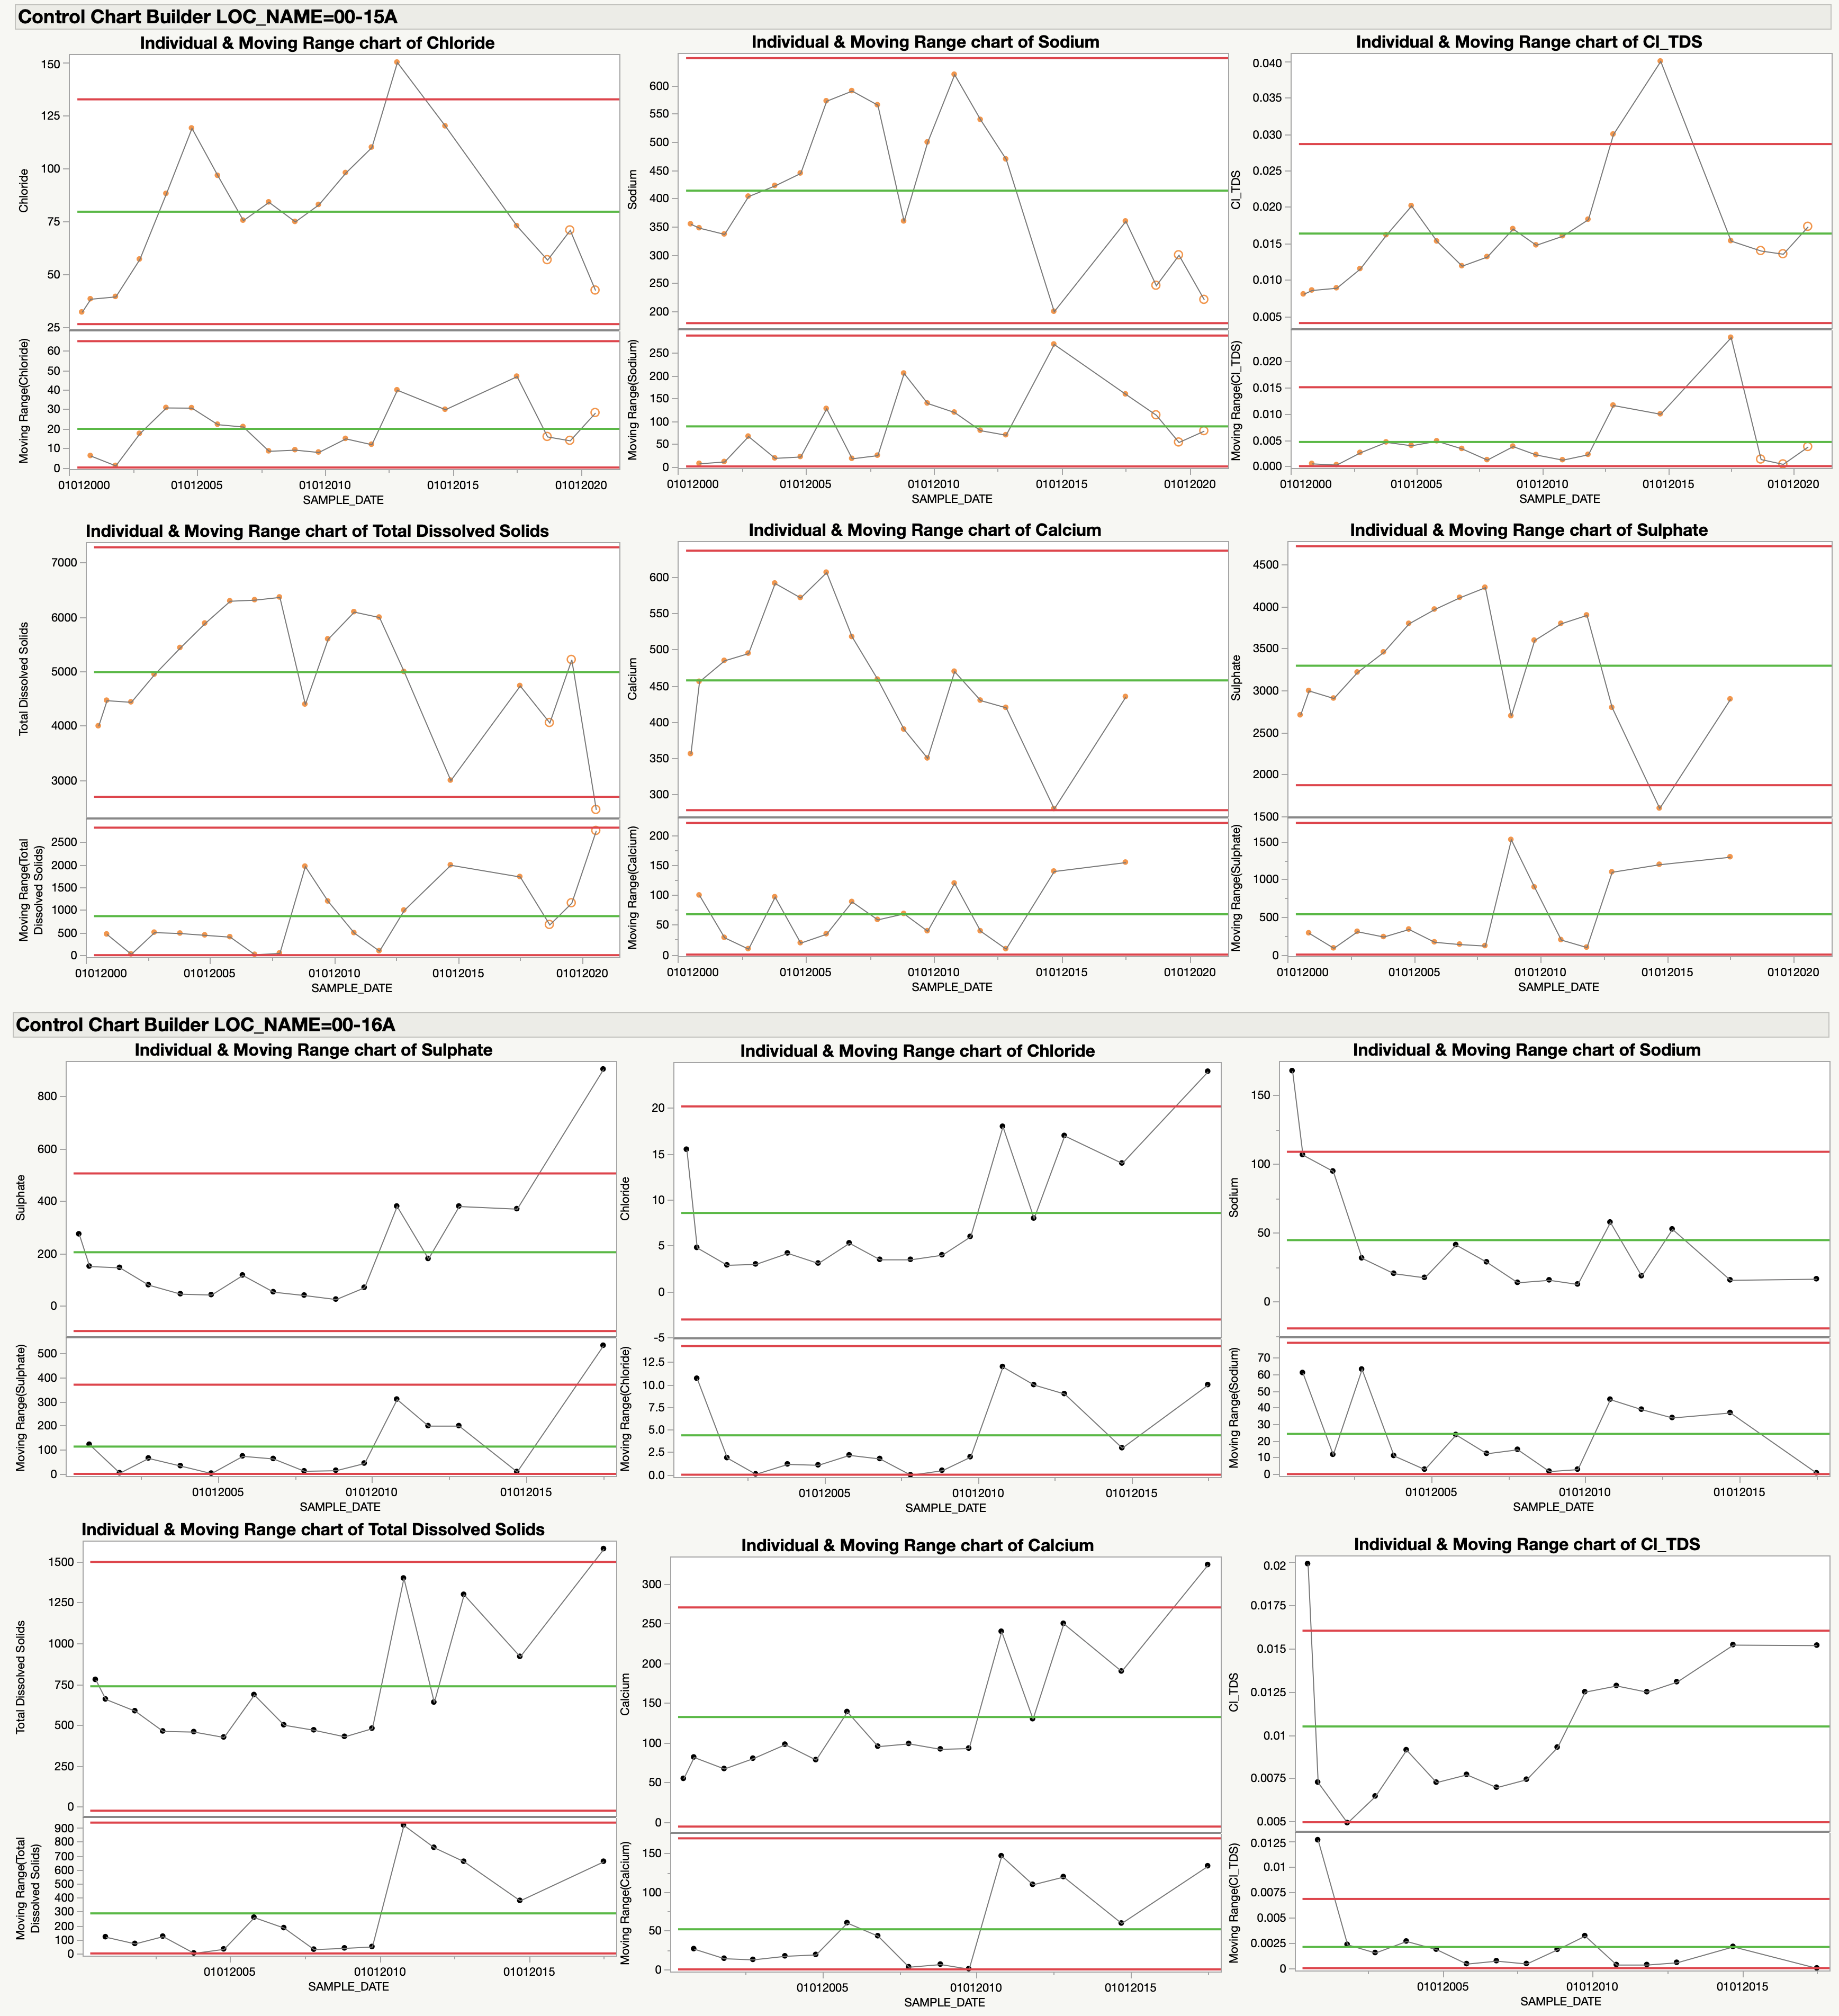
Re: Export all control charts from By column on one page for export to powerpoint
Hello,
I'm looking for them to be transposed basically. See attached picture. Because then I will export each set of 6 graphs as one jpg and insert into powerpoint. See how LOC_NAME = 00-15A has six graphs, and then the next set of six graphs is LOC_NAME = 0016A.
- Mark as New
- Bookmark
- Subscribe
- Mute
- Subscribe to RSS Feed
- Get Direct Link
- Report Inappropriate Content
Re: Export all control charts from By column on one page for export to powerpoint
Below is a script that creates the PowerPoint output from your Example data table
Names Default To Here( 1 );
dt = Current Data Table();

// Get a list of the LOC_Name's that are in the data
Summarize( dt, bygroup = by( :LOC_Name ) );

// Create a display window to put the graphs into
Nw = New Window( "Control Charts" );

// Loop across all of the LOC_Name's creating the six control
// charts
For( i = 1, i <= N Items( bygroup ), i++,

	// Create the Outline Box to hold the 6 charts
	ob = Outline Box( "Control Charts for LOC_Name=" || byGroup[i] );

	// Create a display box of three objects wide
	// With the 6 control charts, it will make it a
	// 2 row 3 column output
	lub = Lineup Box( N Col( 3 ) );

	// Create the 6 charts
	ccb = dt << Control Chart Builder( invisible,
		Show Capability( 0 ),
		Show control panel( 0 ),
		Variables(
			Subgroup( :SAMPLE_DATE ),
			Y(
				:Chloride,
				:Cl_TDS,
				:Sodium,
				:Total Dissolved Solids,
				:Sulphate,
				:Calcium
			)
		),
		show limit summaries( 0 ),
		where( :loc_name == Eval( bygroup[i] ) )
	);

	// Loop across the output pulling out the 6 Picture Boxes
	// that contains the desired output for each control chart
	// and add them to the Lineup Box
	For( k = 1, k <= 6, k++,
		lub << append( Report( ccb )[Picture Box( i )] )
	);

	// Close the no longer needed Control Chart Builder window
	Report( ccb ) << close window;

	// Add the contents of the Line Up Box to the Outline Box
	// but make it a single object so when saved to pptx it will
	// be treated as a single graph
	ob << append( lub << get picture );

	// Add the current outline box to the display window
	nw << append( ob );

);

// Save the graphs to PowerPoint
nw << save presentation( "$TEMP/myppt.pptx" );

// Display the PowerPoint output
Open( "$TEMP/myppt.pptx" );
Please take the time to study the script so you understand the approach I took, so you can make any adjustments needed. The section in the Scripting Guide on Display Trees will give you the background on how I picked apart the output, and built it back into a new display format.
- Mark as New
- Bookmark
- Subscribe
- Mute
- Subscribe to RSS Feed
- Get Direct Link
- Report Inappropriate Content
Re: Export all control charts from By column on one page for export to powerpoint
@txnelson Thank you for the script! That is perfect. I was able to modify one portion to allow all 6 graphs of each sample to save on one powerpoint slide. I really appreciate your help, and I enjoyed learning as I read through the script.
Thanks again!
Recommended Articles
- © 2026 JMP Statistical Discovery LLC. All Rights Reserved.
- Terms of Use
- Privacy Statement
- Contact Us