- Subscribe to RSS Feed
- Mark Topic as New
- Mark Topic as Read
- Float this Topic for Current User
- Bookmark
- Subscribe
- Mute
- Printer Friendly Page
Discussions
Solve problems, and share tips and tricks with other JMP users.- JMP User Community
- :
- Discussions
- :
- Re: Edit quantile box plot
- Mark as New
- Bookmark
- Subscribe
- Mute
- Subscribe to RSS Feed
- Get Direct Link
- Report Inappropriate Content
Edit quantile box plot
I only want to see Quantile box plot that show 5 elements, Max, Min and 75% 50% 25%, not all fences. And include outliers. The only option in JMP 16 graph builder-QUANTILE box plots is showing all 11 elements. Can I customized my own QUANTILE box plot? prefer no scripting. Thanks!
Accepted Solutions
- Mark as New
- Bookmark
- Subscribe
- Mute
- Subscribe to RSS Feed
- Get Direct Link
- Report Inappropriate Content
Re: Edit quantile box plot
You can get what you want by using the Customize capability in JMP.
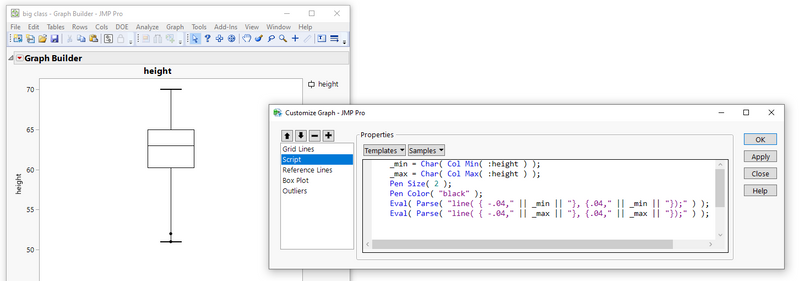
If you generate a histogram using Graph Builder, specifying not to draw the Fences, one can then use the Customize to add back in the Fences you want.
Right click on the graph and select Customize. Then click on the + to add a script, and copy in the simple script commands into the Customize window, and press Apply. It will add in the 2 fences you want.
- Mark as New
- Bookmark
- Subscribe
- Mute
- Subscribe to RSS Feed
- Get Direct Link
- Report Inappropriate Content
Re: Edit quantile box plot
Create your Box plot and then right click on the plot and there will be a number of options for you.
- Mark as New
- Bookmark
- Subscribe
- Mute
- Subscribe to RSS Feed
- Get Direct Link
- Report Inappropriate Content
Re: Edit quantile box plot
. Thanks. But I only can choose no fences or all the fences. I want to only fence Max and Min.
- Mark as New
- Bookmark
- Subscribe
- Mute
- Subscribe to RSS Feed
- Get Direct Link
- Report Inappropriate Content
Re: Edit quantile box plot
Try changing it to an outlier Box Type
- Mark as New
- Bookmark
- Subscribe
- Mute
- Subscribe to RSS Feed
- Get Direct Link
- Report Inappropriate Content
Re: Edit quantile box plot
Try changing the Box Style to Solid. I think that might be what you want. It doesn't really make sense to me, but this is what I get with the Solid Quantile box.
- Mark as New
- Bookmark
- Subscribe
- Mute
- Subscribe to RSS Feed
- Get Direct Link
- Report Inappropriate Content
Re: Edit quantile box plot
You can get what you want by using the Customize capability in JMP.
If you generate a histogram using Graph Builder, specifying not to draw the Fences, one can then use the Customize to add back in the Fences you want.
Right click on the graph and select Customize. Then click on the + to add a script, and copy in the simple script commands into the Customize window, and press Apply. It will add in the 2 fences you want.
Recommended Articles
- © 2026 JMP Statistical Discovery LLC. All Rights Reserved.
- Terms of Use
- Privacy Statement
- Contact Us


