Turn on suggestions
Auto-suggest helps you quickly narrow down your search results by suggesting possible matches as you type.
- Don’t miss your chance to experience Discovery Summit Europe at our best available rate! Early bird registration through 31 Oct.
- Graph Builder Toolbar streamlines interactive graphing. Creates shortcuts on Report and GraphBuilder Helpers toolbars. Download and install the extension.
- JMP will suspend normal business operations for our Rest and Recharge Day on Friday, October 2, 2026.
Regular business hours will resume on Monday, October 5, 2026.
Options
- Subscribe to RSS Feed
- Mark Topic as New
- Mark Topic as Read
- Float this Topic for Current User
- Bookmark
- Subscribe
- Mute
- Printer Friendly Page
Discussions
Solve problems, and share tips and tricks with other JMP users.- User Community
- :
- Discussions
- :
- Re: Discriminant Analysis > Normal 50% Contours > Save for Replot in Graph Build...


Super User
- Mark as New
- Bookmark
- Subscribe
- Mute
- Subscribe to RSS Feed
- Get Direct Link
- Report Inappropriate Content
Discriminant Analysis > Normal 50% Contours > Save for Replot in Graph Builder?
Created:
Oct 4, 2020 12:56 AM
| Last Modified: Jun 11, 2023 4:06 AM
(2354 views)
Hi JMP Community,
I have conducted a Discriminant Analysis using measurements of 92 biomarkers associated with 3 biological states denoted as Dummy: B, C, and D; see canonical plot below:
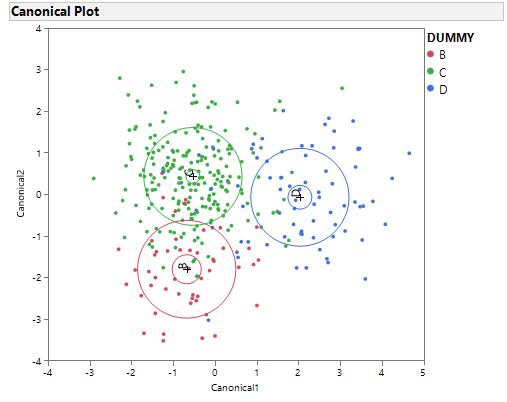
Now, after saving the Canonical Scores to by data table, I would like to fine tune this plot in GraphBuilder but I have not been able to figure out how to reproduce the Normal 50% Contours; here is what I have so far: the shaded ellipses are clearly not matching the original Canonical Plot above.
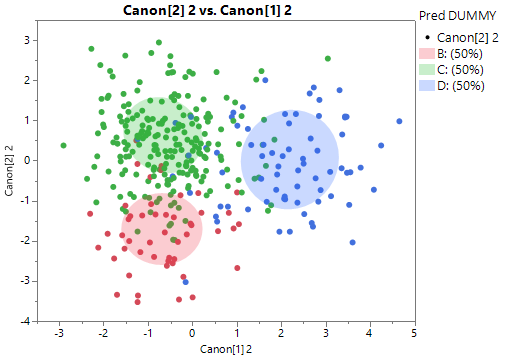
Any help would be welcome.
Best,
TS
Thierry R. Sornasse
1 ACCEPTED SOLUTION
Accepted Solutions
Super User
Solution
- Mark as New
- Bookmark
- Subscribe
- Mute
- Subscribe to RSS Feed
- Get Direct Link
- Report Inappropriate Content
Re: Discriminant Analysis > Normal 50% Contours > Save for Replot in Graph Builder?
Hi JMP Community,
I found an ugly work around to reach my goal:
1) In the Discriminant Analysis platform > Canonical Plot: Click Customize
2) Copy the 3 non-editable graphic scripts for Normal 50% Contours, Means 95% CL Ellipses, and Group Labels into a new script window
3) Create the desired plot in Graph Builder (i.e. saved Canonical 1 vs. Canonical 2 values)
4) Click Customize and add the 3 saved graphic scripts describe above which our now editable (e.g. "Text Color", "Text Size", "Pen Size")
I would love to hear the input from anybody with a better idea.
Best,
TS
I found an ugly work around to reach my goal:
1) In the Discriminant Analysis platform > Canonical Plot: Click Customize
2) Copy the 3 non-editable graphic scripts for Normal 50% Contours, Means 95% CL Ellipses, and Group Labels into a new script window
3) Create the desired plot in Graph Builder (i.e. saved Canonical 1 vs. Canonical 2 values)
4) Click Customize and add the 3 saved graphic scripts describe above which our now editable (e.g. "Text Color", "Text Size", "Pen Size")
I would love to hear the input from anybody with a better idea.
Best,
TS
Thierry R. Sornasse
1 REPLY 1
Super User
Solution
- Mark as New
- Bookmark
- Subscribe
- Mute
- Subscribe to RSS Feed
- Get Direct Link
- Report Inappropriate Content
Re: Discriminant Analysis > Normal 50% Contours > Save for Replot in Graph Builder?
Hi JMP Community,
I found an ugly work around to reach my goal:
1) In the Discriminant Analysis platform > Canonical Plot: Click Customize
2) Copy the 3 non-editable graphic scripts for Normal 50% Contours, Means 95% CL Ellipses, and Group Labels into a new script window
3) Create the desired plot in Graph Builder (i.e. saved Canonical 1 vs. Canonical 2 values)
4) Click Customize and add the 3 saved graphic scripts describe above which our now editable (e.g. "Text Color", "Text Size", "Pen Size")
I would love to hear the input from anybody with a better idea.
Best,
TS
I found an ugly work around to reach my goal:
1) In the Discriminant Analysis platform > Canonical Plot: Click Customize
2) Copy the 3 non-editable graphic scripts for Normal 50% Contours, Means 95% CL Ellipses, and Group Labels into a new script window
3) Create the desired plot in Graph Builder (i.e. saved Canonical 1 vs. Canonical 2 values)
4) Click Customize and add the 3 saved graphic scripts describe above which our now editable (e.g. "Text Color", "Text Size", "Pen Size")
I would love to hear the input from anybody with a better idea.
Best,
TS
Thierry R. Sornasse
Recommended Articles
- © 2026 JMP Statistical Discovery LLC. All Rights Reserved.
- Terms of Use
- Privacy Statement
- Contact Us