- Subscribe to RSS Feed
- Mark Topic as New
- Mark Topic as Read
- Float this Topic for Current User
- Bookmark
- Subscribe
- Mute
- Printer Friendly Page
Discussions
Solve problems, and share tips and tricks with other JMP users.- JMP User Community
- :
- Discussions
- :
- Different minimal defect control range for defect profiler versus design space p...
- Mark as New
- Bookmark
- Subscribe
- Mute
- Subscribe to RSS Feed
- Get Direct Link
- Report Inappropriate Content
Different minimal defect control range for defect profiler versus design space profiler
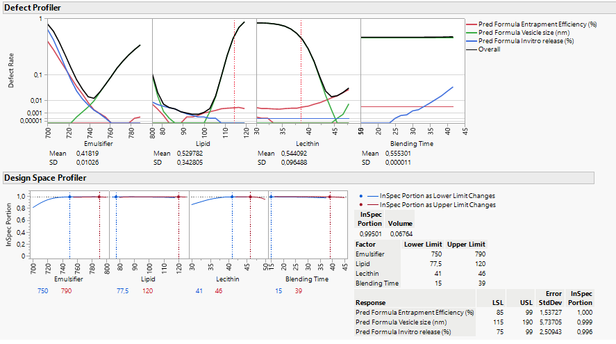
Goal of a study is to find control space of four factors so that three responses are within specification. In the profiler simulator first I used the defect profiler to check the impact of the factors on the defect rate given in the upper graph below. Then I used the design space profiler shown in the lower graph: results for minimum defect rate are different, why? I accept the control ranges of the design space profiler but why are first esimations of the minimal defect ranges by the defect profiler, different?
Accepted Solutions
- Mark as New
- Bookmark
- Subscribe
- Mute
- Subscribe to RSS Feed
- Get Direct Link
- Report Inappropriate Content
Re: Different minimal defect control range for defect profiler versus design space profiler
Hi @frankderuyck,
I found this post without any response and thought it would be worth providing a response, so that future users may get help if facing the same question.
The "trick" to have similar results between Design Space Profiler and Defect Profiler is to adjust all corresponding factors ranges and distributions in the same way between the two platforms, as they are not directly linked.
Using the Bounce Data dataset in the JMP sample library, I specified Spec limits on the response "Stretch" (LSL=400, Target=450, USL=500) :
Then I create a model, and open the Design Space Profiler to find the correct factors ranges that help minimize the proportion of out-of-spec samples :
With these factors ranges, I can expect 97,74% of my samples to be in spec.
Opening now the Simulator, I specify these factors ranges using Uniform distributions (Distribution choice has an influence on the defect rate), and then clicking on "Simulate" :
I have now a Defect rate of 2,23%, so very close from what I could obtain from Design Space Profiler (P=100-Inspec=100-97,74=2,26%). Remember that the Simulator calculations are based on Monte-Carlo simulations, so Defect rate can vary a little bit at each simulation, but the result should be close to the Design Space Profiler. The two platforms are now aligned.
Finally, looking at the Defect Profiler, you should adjust the factors ranges of this profiler (right-click on X axis, and in "Axis Settings", specify the min and max values of your factors to match the Design Space Profiler's ranges) so that the defect rate are only calculated based on the same ranges of the Simulator and Design Space Profiler :
The max defect rate on this Profiler can be found at 2,27%, so quite close from the one found with the Simulator (2,23%) and from the Design Space Profiler (2,26%).
Fixing the same factors ranges of the Design Space Profiler on the Simulator and Defect Profiler enables to find similar Defect rates.
Hope this answer might help other users,
"It is not unusual for a well-designed experiment to analyze itself" (Box, Hunter and Hunter)
Recommended Articles
- © 2026 JMP Statistical Discovery LLC. All Rights Reserved.
- Terms of Use
- Privacy Statement
- Contact Us


