- New to JMP? Join us Sept. 23-24 for the Early User Edition of Discovery Summit, tailor-made for new users. Register now for free!
- Use World Cup data to build models, explore spatial relationships, and create informative visualizations in JMP. Register. July 17, 2 pm US Eastern Time.
- Your voice matters! Tell us how you prefer to receive JMP updates, so we can tailor our communication to your needs. Take short survey.
- Subscribe to RSS Feed
- Mark Topic as New
- Mark Topic as Read
- Float this Topic for Current User
- Bookmark
- Subscribe
- Mute
- Printer Friendly Page
Discussions
Solve problems, and share tips and tricks with other JMP users.- JMP User Community
- :
- Discussions
- :
- Re: DOE: What is the null hypothesis test in effect summary table (pvalue) and p...

- Mark as New
- Bookmark
- Subscribe
- Mute
- Subscribe to RSS Feed
- Get Direct Link
- Report Inappropriate Content
DOE: What is the null hypothesis test in effect summary table (pvalue) and parameter estimate (prob>|t|)
Hi,
Can someone help me to understand the null/alternate hypothesis test in effect summary and parameter estimate table?
is there document explain it with equation?
Thanks

- Mark as New
- Bookmark
- Subscribe
- Mute
- Subscribe to RSS Feed
- Get Direct Link
- Report Inappropriate Content
Re: DOE: What is the null hypothesis test in effect summary table (pvalue) and parameter estimate (prob>|t|)
I may be running the risk of oversimplifying, but the null hypothesis is NULL because it takes the stance of "no effect" or "no difference". For parameter effects, that means the null hypothesis is "This factor has no effect" which means "The parameter estimate for this effect equals zero."
The alternative hypothesis is the opposite of the null. So, "this parameter estimate is different than zero."
- Mark as New
- Bookmark
- Subscribe
- Mute
- Subscribe to RSS Feed
- Get Direct Link
- Report Inappropriate Content
Re: DOE: What is the null hypothesis test in effect summary table (pvalue) and parameter estimate (prob>|t|)
Hi,
I'm getting confused.
1)it looks like both hypothesis test in Effect Summary and Parameter Estimate is testing "no effect".
my question:
1) what is the t-test equation for these 2 tests?
2) what these 2 type of hypothesis test against
- Effect summary hypothesis (Pvalue)
- Parameter estimate (Prob>|t|)

- Mark as New
- Bookmark
- Subscribe
- Mute
- Subscribe to RSS Feed
- Get Direct Link
- Report Inappropriate Content
Re: DOE: What is the null hypothesis test in effect summary table (pvalue) and parameter estimate (prob>|t|)
In general, test of significance (p-values) are tests based on rejecting or not rejecting the Null Hypothesis. The p-value is the associated probability of a Type 1 or alpha error (rejecting the Null when the Null is true). These tests can be done on different statistics with different associated probability distributions (e.g., t, F, Chi square, etc). The Parameter Estimates reports the coefficients of the model and Prob>|t| is the probability a value greater than the calculated t Ratio (Estimate/Std Error) could exist by chance alone (this is actually area of the probability distribution, in this case Student's t-distribution beyond the calculated test statistic) . Effects tests use the calculated F ratio (mean square effect/mean square error) in the same way. The Prob>F is the probability a value greater than the calculated F-Ratio could exist by chance alone (i.e., when the effect = 0).
This picture might clarify graphically what is being calculated.

- Mark as New
- Bookmark
- Subscribe
- Mute
- Subscribe to RSS Feed
- Get Direct Link
- Report Inappropriate Content
Re: DOE: What is the null hypothesis test in effect summary table (pvalue) and parameter estimate (prob>|t|)
Hi,
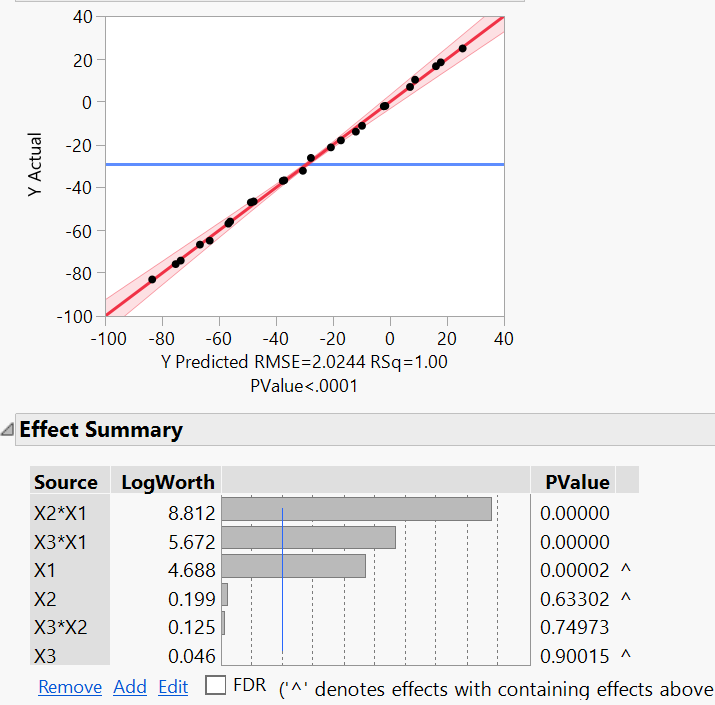
I still don't get the "mean square effect/mean square error" related to the P value in effect summary.
Please refer to the attachment. This is the Pvalue in Effect summary table. Can you help me to understand how individual effect's pvalue is calculated?
- Mark as New
- Bookmark
- Subscribe
- Mute
- Subscribe to RSS Feed
- Get Direct Link
- Report Inappropriate Content
Re: DOE: What is the null hypothesis test in effect summary table (pvalue) and parameter estimate (prob>|t|)

- Mark as New
- Bookmark
- Subscribe
- Mute
- Subscribe to RSS Feed
- Get Direct Link
- Report Inappropriate Content
Re: DOE: What is the null hypothesis test in effect summary table (pvalue) and parameter estimate (prob>|t|)
The Analysis of Variance table tests the 'whole model.' That is, the null hypothesis is that all the parameters (except the constant term) are zero versus the alternative hypothesis that not all the parameters are zero. The test is based on the ratio of variances (MS Model / MS Error). This F ratio is used to obtain the p-value that is reported in the Analysis of Variance table and also below horizontal axis of the Actual by Predicted plot.
The Effect Summary reports tests for individual parameter estimates. It compares the parameter estimate to the hypothesized parameter (zero) by difference and then makes a t ratio by dividing by the standard error of the estimate. The t ratio is, therefore, the number of standard errors that the estimate is from the hypothesized value. The t ratio is used to obtain the p-value in the Effects Summary table.
Note that while both of these tests are asking a question about the parameter estimates, they are not asking the same question. They are also not using the same method to obtain an answer. So they will not necessarily agree or provide consistent answers. For example, the whole model F test might indicate that you should not reject the null hypothesis while one or more of the t tests might indicate that you should reject the null. Remember that they are not the same hull hypothesis.
Recommended Articles
- © 2026 JMP Statistical Discovery LLC. All Rights Reserved.
- Terms of Use
- Privacy Statement
- Contact Us