- Learn how to build custom Python data connectors and further customize JMP’s Data Connector Framework with the Python Data Connector Demo, available now in the JMP Marketplace!
- See how to move from signal modeling to system modeling at the first JMP Aerospace Analytics webinar. Register. June 18, 1 p.m. US Eastern Time.
- Subscribe to RSS Feed
- Mark Topic as New
- Mark Topic as Read
- Float this Topic for Current User
- Bookmark
- Subscribe
- Mute
- Printer Friendly Page
Discussions
Solve problems, and share tips and tricks with other JMP users.- JMP User Community
- :
- Discussions
- :
- Custom DoE (RSM) with variables that change level during experiment

- Mark as New
- Bookmark
- Subscribe
- Mute
- Subscribe to RSS Feed
- Get Direct Link
- Report Inappropriate Content
Custom DoE (RSM) with variables that change level during experiment
Hi Community,
I am trying to design a response surface experiment but am unsure of how I can include variables that change level during the experiment. How do I plot in variables with changing levels in the custom DoE editor?
Constraints:
- 24 experiments in 1 block (not sure if possible)
- Experiment runs over 16 days with sampling points every day (with a response curve (Y) as the result)
- Response surface design with 4 variables (all continuous with 3 levels: -1, 0, 1):
- X1 (-> X1_end on day of change)
- X2 (-> X2_end on day of change)
- Day of Change
- Rate of change factor (F)
- X1 and X2 are ‘translated’ into X1_end and X2_end on day Z by a factor (F).
I have tried to visualize it in attached picture.
Thanks alot!

Accepted Solutions

- Mark as New
- Bookmark
- Subscribe
- Mute
- Subscribe to RSS Feed
- Get Direct Link
- Report Inappropriate Content
Re: Custom DoE (RSM) with variables that change level during experiment
In Fit Model you can either specify all of the responses in the Y role. In this case you will have to fit the same model (e.g the full RSM model) to all responses. At the bottom of the report will be a profiler with all responses together.
Or you can fit different models to each response and then save them as Prediction Formula columns to the table. You can then profile all of these - use Profiler from the Graph menu.
I haven't tried the spectral profiler in PLS. I think that could work. I will have a look if I get time. If you get chance to try, can you please let me know if it works.

- Mark as New
- Bookmark
- Subscribe
- Mute
- Subscribe to RSS Feed
- Get Direct Link
- Report Inappropriate Content
Re: Custom DoE (RSM) with variables that change level during experiment
Without giving away trade secrets, can you say a little more about what the factors X1 and X2 are, please? Also, some more details about what the response is and what you hope to learn from the experiment would be good.
In DoE, you actively manipulate the levels of the chosen factors to learn something specific. By using 'hard' and 'very hard' to change factors you can handle situations in which the experimental set-up dictates that changing between factor levels has some restrictions. I have the sense that this might be what you are trying to do, but I'm not sure from what you have written.
- Mark as New
- Bookmark
- Subscribe
- Mute
- Subscribe to RSS Feed
- Get Direct Link
- Report Inappropriate Content
Re: Custom DoE (RSM) with variables that change level during experiment
Hi Ian, I can do that. The experiment is a fed-batch cell culture: The response is a concentration curve of the protein the cells are producing (and the end value).
The purpose of the experiment is to optimize the protein-concentration by varying two feeds (X1 and X2). The feed concentrations will be changed on a ‘day of change’ to X1_end and X2_end (I have decided not to include the formerly mentioned ‘factor of change (F)’).
The feeds are being delivered to the cell culture once per day during the fed-batch and contain various nutrients. Each feed is delivered by a %, and can be treated as a continuous variable. Day of change is also a continuous variable. All factors are easy to change. Since the cells are growing and have metabolic shifts during the fed-batch, they will need different amounts of the (complex) feeds at different times during the culture. I do not know what may or may not be limiting in the feeds at this point in time, but I do know that the ranges I am examining are relevant.
My question is: Is it even possible to include 5 continuous factors when each of them are only active for a certain period during the experiment? How should I treat factors that are changing levels during the experiment? Is there a general rule of thumb?
If I plot in 5 continuous factors &RS in the custom DoE editor, I get 28 recommended experiments to perform, which is OK (see attachment). I also assume that not all factors are active. The power is not impressive on this experiment, but I am able to augment it, if necessary. Once I have the data I can do the analysis on the final timepoint - but I also want the option to perform PLS on the concentration curve vs. my factors over time.
I might be way off :) And that's why I'm here.
I hope this clears up matters a bit
Thanks!
- Mark as New
- Bookmark
- Subscribe
- Mute
- Subscribe to RSS Feed
- Get Direct Link
- Report Inappropriate Content
Re: Custom DoE (RSM) with variables that change level during experiment
Hi,
This is very interesting. Thanks for sharing.
I dont see any problem with the experiment that you have proposed.
From what I understand, each of the runs in the experiment is an entirely new run of the process. Things get more complicated when that is not the case and you need to consider hard-to-change factors.
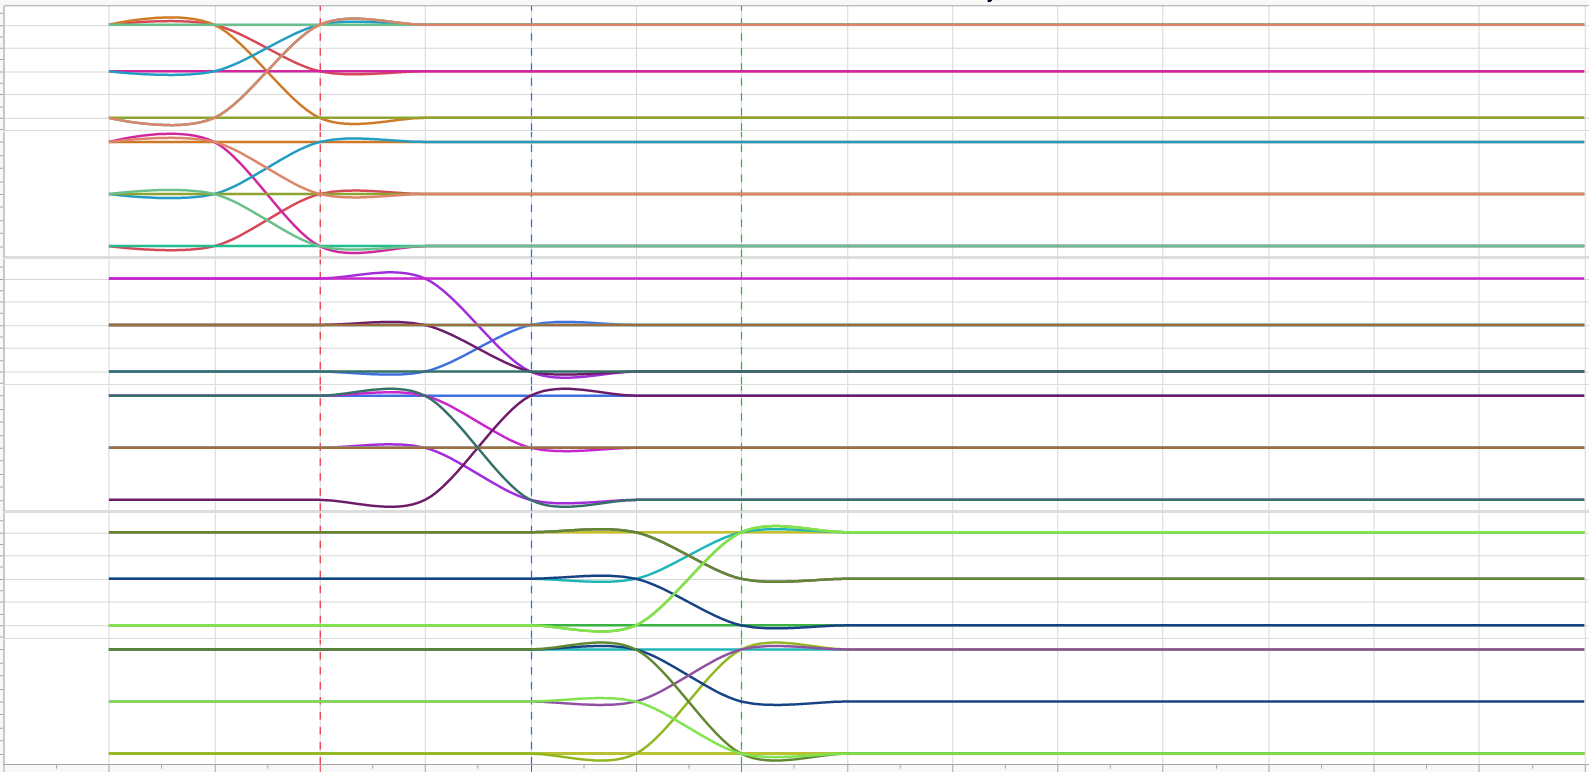
Have a think about what the model at the end will look like. Imagine the prediction profiler that you will get (e.g. below). Do all of the possible settings make sense? Are all settings feasible? Can you interpret the effect of changes in the factors in a way that makes sense to the objective of the experiment? I would recommend simulating some response data to check this (blog on simulate responses).
Regards,
Phil

- Mark as New
- Bookmark
- Subscribe
- Mute
- Subscribe to RSS Feed
- Get Direct Link
- Report Inappropriate Content
Re: Custom DoE (RSM) with variables that change level during experiment
Hi Phil,
Each of the runs in the experiment is a bioreactor running a full fed-batch - so yes, an entirely new run each time. All bioreactors are programmable and the feed-factors are the execution of an equation resulting in an absolute volume (which I can analyze as a volume-%).
To your other questions:
Do all of the possible settings make sense? Yes - all do and all are interesting for me.
Are all settings feasible? Yes - I have selected ranges to accomodate what is possible on this particular system (and for future scale-up).
Can you interpret the effect of changes in the factors in a way that makes sense to the objective of the experiment? I hope so - in principle I can calculate the productivity of each cell and see how that changes over time. So I hope to correlate that to how the feed is changing over time (for example).
I would recommend simulating some response data to check this (blog on simulate responses). I'll check it out, thanks!
- Mark as New
- Bookmark
- Subscribe
- Mute
- Subscribe to RSS Feed
- Get Direct Link
- Report Inappropriate Content
Re: Custom DoE (RSM) with variables that change level during experiment
It occurs to me that the complicating aspect of this is that all factors could be active for the response at the end point but some factors are not relevant for the response at eariler time points (before change in X1 and X2). I dont think this is a problem for how you design the experiment. It is something you will need to think about for the analysis. Before analysing the whole curve with PLS you might want to analyse each time point as a separate response to check that it makes sense.
- Mark as New
- Bookmark
- Subscribe
- Mute
- Subscribe to RSS Feed
- Get Direct Link
- Report Inappropriate Content
Re: Custom DoE (RSM) with variables that change level during experiment
My original thought was to simply take each time point and analyze with respect to my factors as they are at the timepoint - and then concatenate all analyses at the end. But I thought that there might be an easier way to do it. But since you suggest it I think I'll reconsider! Awesome :)
- Mark as New
- Bookmark
- Subscribe
- Mute
- Subscribe to RSS Feed
- Get Direct Link
- Report Inappropriate Content
Re: Custom DoE (RSM) with variables that change level during experiment
This brings me to some other practicalities:
Is there an easy way to concatenate analyses from each timepoint together in a profiler window? Is there an option to load reduced models from each timepoint into a spectral profiler directly, for example?
thanks alot
PS: I'm trying to give all of you kudos, but the buttons don't work for me.
- Mark as New
- Bookmark
- Subscribe
- Mute
- Subscribe to RSS Feed
- Get Direct Link
- Report Inappropriate Content
Re: Custom DoE (RSM) with variables that change level during experiment
In Fit Model you can either specify all of the responses in the Y role. In this case you will have to fit the same model (e.g the full RSM model) to all responses. At the bottom of the report will be a profiler with all responses together.
Or you can fit different models to each response and then save them as Prediction Formula columns to the table. You can then profile all of these - use Profiler from the Graph menu.
I haven't tried the spectral profiler in PLS. I think that could work. I will have a look if I get time. If you get chance to try, can you please let me know if it works.
- Mark as New
- Bookmark
- Subscribe
- Mute
- Subscribe to RSS Feed
- Get Direct Link
- Report Inappropriate Content
Re: Custom DoE (RSM) with variables that change level during experiment
all good suggestions. I will check them all out and hold them up against each other once i have obtained my data.
thanks alot for all of the help
PS: Attached is a visualization of the design (with no axes, but you get the jist of it) :)
Recommended Articles
- © 2026 JMP Statistical Discovery LLC. All Rights Reserved.
- Terms of Use
- Privacy Statement
- Contact Us