- Don’t miss your chance to experience Discovery Summit Europe at our best available rate! Early bird registration through 31 Oct.
- Graph Builder Toolbar streamlines interactive graphing. Creates shortcuts on Report and GraphBuilder Helpers toolbars. Download and install the extension.
- Subscribe to RSS Feed
- Mark Topic as New
- Mark Topic as Read
- Float this Topic for Current User
- Bookmark
- Subscribe
- Mute
- Printer Friendly Page
Discussions
Solve problems, and share tips and tricks with other JMP users.- User Community
- :
- Discussions
- :
- Re: Creating a boxplot and histogram view in a single chart

- Mark as New
- Bookmark
- Subscribe
- Mute
- Subscribe to RSS Feed
- Get Direct Link
- Report Inappropriate Content
Creating a boxplot and histogram view in a single chart
I am trying to re-create a chart as shown below where a box plot is shown for a discrete lot level on the x-axis and a vertical histogram of the entire data set is on the right hand side of the chart.
Is there a way to do this in Graph Builder or is this only achievable with jsl?

Accepted Solutions

- Mark as New
- Bookmark
- Subscribe
- Mute
- Subscribe to RSS Feed
- Get Direct Link
- Report Inappropriate Content
Re: Creating a boxplot and histogram view in a single chart
For the X axis, hold down alt and resize the x axis panel
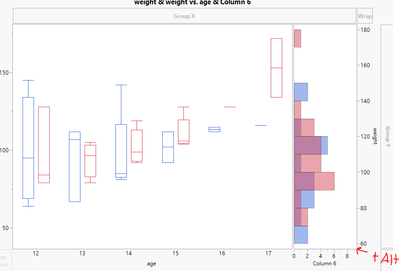
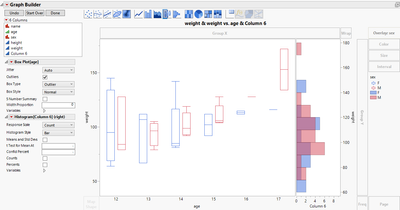
For having the two panels respect difference Y axis scales, add in another of the same Y axis (here I used weight from the Big Class sample data set) and then move one of them to the right (right click on the Y axis when it says Weight & Weight and select move right and choose one to move)
- Mark as New
- Bookmark
- Subscribe
- Mute
- Subscribe to RSS Feed
- Get Direct Link
- Report Inappropriate Content
Re: Creating a boxplot and histogram view in a single chart
Hey @BrianB
I just made a dummy column of all 1's (Column 6) and added that as an additional panel on the X axis

- Mark as New
- Bookmark
- Subscribe
- Mute
- Subscribe to RSS Feed
- Get Direct Link
- Report Inappropriate Content
Re: Creating a boxplot and histogram view in a single chart
Fantastic thank you.
2 questions to get the same view
1. How do you scale the portion of the x-axis for the boxplot vs the histogram?
2. is it only possible to have a single y-axis interval setting or can the box plot and histogram have different intervals (whilst retaining the same overall scale)
- Mark as New
- Bookmark
- Subscribe
- Mute
- Subscribe to RSS Feed
- Get Direct Link
- Report Inappropriate Content
Re: Creating a boxplot and histogram view in a single chart
For the X axis, hold down alt and resize the x axis panel
For having the two panels respect difference Y axis scales, add in another of the same Y axis (here I used weight from the Big Class sample data set) and then move one of them to the right (right click on the Y axis when it says Weight & Weight and select move right and choose one to move)
- Mark as New
- Bookmark
- Subscribe
- Mute
- Subscribe to RSS Feed
- Get Direct Link
- Report Inappropriate Content
Re: Creating a boxplot and histogram view in a single chart
Great, thank you
Recommended Articles
- © 2026 JMP Statistical Discovery LLC. All Rights Reserved.
- Terms of Use
- Privacy Statement
- Contact Us