- Learn how to build custom Python data connectors and further customize JMP’s Data Connector Framework with the Python Data Connector Demo, available now in the JMP Marketplace!
- See how to create experiments to support product design and ID useful product features. Register for June 12 webinar, 2pm US Eastern Time.
- Subscribe to RSS Feed
- Mark Topic as New
- Mark Topic as Read
- Float this Topic for Current User
- Bookmark
- Subscribe
- Mute
- Printer Friendly Page
Discussions
Solve problems, and share tips and tricks with other JMP users.- JMP User Community
- :
- Discussions
- :
- Creating a Pass Fail Map in JMP

- Mark as New
- Bookmark
- Subscribe
- Mute
- Subscribe to RSS Feed
- Get Direct Link
- Report Inappropriate Content
Creating a Pass Fail Map in JMP
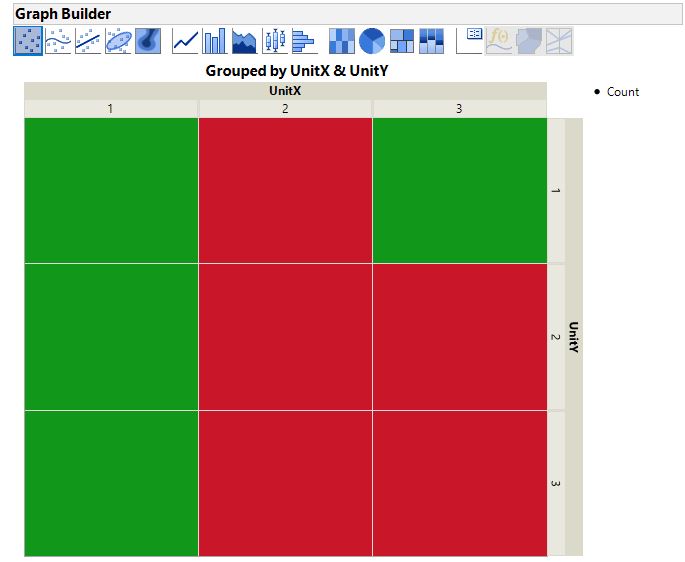
I have inspected a wafer with 9 units on it. It is a 3X3 array of units (9 samples or parts) on wafer. I have their Column Row number and pass fail results in a table. A sample table is attached. I was wondering if it is possible to create a pass fail map graph (attached) where pass units are highlighted in green and failed units are highlighted in red. I would like to create a JSL script to do this. Any guidance will be highly appreciated.
Thanks
Accepted Solutions

- Mark as New
- Bookmark
- Subscribe
- Mute
- Subscribe to RSS Feed
- Get Direct Link
- Report Inappropriate Content
Re: Creating a Pass Fail Map in JMP
If I understand you correctly, you attached an example of the desired plot. You can click the red triangle at the top right of Graph Builder and select Save Script > To Script Window. This script can be used as it or modified as needed.
Recommended Articles
- © 2026 JMP Statistical Discovery LLC. All Rights Reserved.
- Terms of Use
- Privacy Statement
- Contact Us