Turn on suggestions
Auto-suggest helps you quickly narrow down your search results by suggesting possible matches as you type.
- Don’t miss your chance to experience Discovery Summit Europe at our best available rate! Early bird registration through 31 Oct.
- Graph Builder Toolbar streamlines interactive graphing. Creates shortcuts on Report and GraphBuilder Helpers toolbars. Download and install the extension.
- JMP will suspend normal business operations for our Rest and Recharge Day on Friday, October 2, 2026.
Regular business hours will resume on Monday, October 5, 2026.
Options
- Subscribe to RSS Feed
- Mark Topic as New
- Mark Topic as Read
- Float this Topic for Current User
- Bookmark
- Subscribe
- Mute
- Printer Friendly Page
Discussions
Solve problems, and share tips and tricks with other JMP users.- User Community
- :
- Discussions
- :
- Create count analysis like excel pivot

Level II
- Mark as New
- Bookmark
- Subscribe
- Mute
- Subscribe to RSS Feed
- Get Direct Link
- Report Inappropriate Content
Create count analysis like excel pivot
Created:
Mar 25, 2021 11:19 PM
| Last Modified: Jun 10, 2023 4:27 PM
(3532 views)
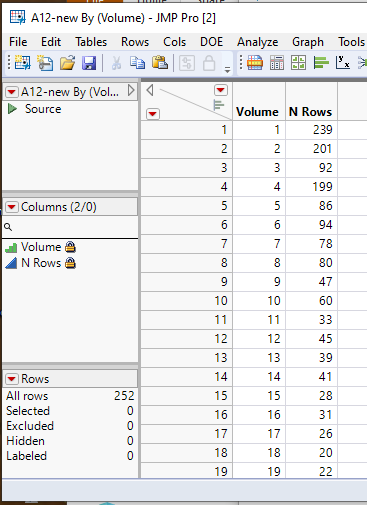
In this file, each row has its own volume value, I would like to have a summary table showing that:
volume = 1, 239 counts,
volume = 2, 201 counts
volume = 3, 92 counts
.....etc
How to make this kind of table?
1 ACCEPTED SOLUTION
Accepted Solutions


Super User
Solution
- Mark as New
- Bookmark
- Subscribe
- Mute
- Subscribe to RSS Feed
- Get Direct Link
- Report Inappropriate Content
Re: Create count analysis like excel pivot
Created:
Mar 25, 2021 11:46 PM
| Last Modified: Mar 25, 2021 8:58 PM
(3527 views)
| Posted in reply to message from Hans_Hsu 03-25-2021
- Change the modeling type for your Volume column to Ordinal
- Go to the pull down menu Analyze=>Tabulate
- Drag column Volume to the Drop zone for rows
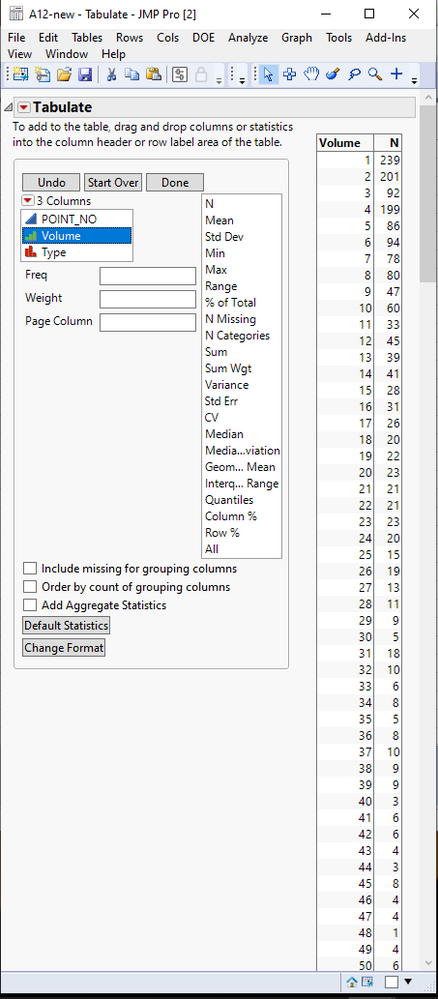
If you want the data in a data table, just click on the red triangle and select Make into Data Table
OR
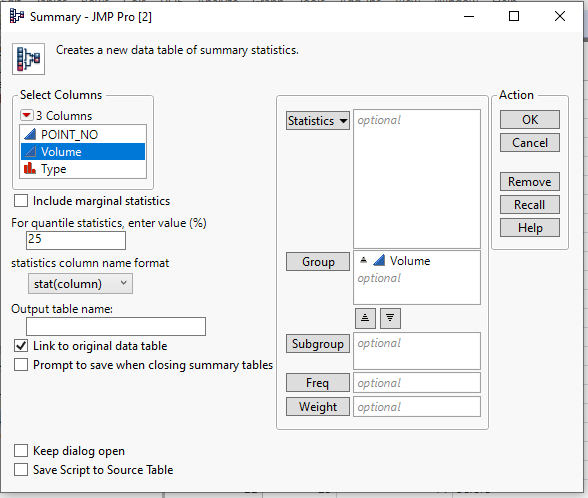
- Go to pull down menu Tables=>Summary
- Select the Volume column from the Select Columns box and click on the Group button to add it to the Group selection
- Click on OK
I encourage you to take the time to read the Discovering JMP document under the Help pull down menu
Jim
1 REPLY 1
Super User
Solution
- Mark as New
- Bookmark
- Subscribe
- Mute
- Subscribe to RSS Feed
- Get Direct Link
- Report Inappropriate Content
Re: Create count analysis like excel pivot
Created:
Mar 25, 2021 11:46 PM
| Last Modified: Mar 25, 2021 8:58 PM
(3528 views)
| Posted in reply to message from Hans_Hsu 03-25-2021
- Change the modeling type for your Volume column to Ordinal
- Go to the pull down menu Analyze=>Tabulate
- Drag column Volume to the Drop zone for rows
If you want the data in a data table, just click on the red triangle and select Make into Data Table
OR
- Go to pull down menu Tables=>Summary
- Select the Volume column from the Select Columns box and click on the Group button to add it to the Group selection
- Click on OK
I encourage you to take the time to read the Discovering JMP document under the Help pull down menu
Jim
Recommended Articles
- © 2026 JMP Statistical Discovery LLC. All Rights Reserved.
- Terms of Use
- Privacy Statement
- Contact Us