- JMP Statement Regarding Critical PHP Remote Code Execution Vulnerabilities (CVE-2026-109618, CVE-2026-109619)
- Don’t miss your chance to experience Discovery Summit Europe at our best available rate! Early bird registration through 31 Oct.
- Graph Builder Toolbar streamlines interactive graphing. Creates shortcuts on Report and GraphBuilder Helpers toolbars. Download and install the extension.
- Subscribe to RSS Feed
- Mark Topic as New
- Mark Topic as Read
- Float this Topic for Current User
- Bookmark
- Subscribe
- Mute
- Printer Friendly Page
Discussions
Solve problems, and share tips and tricks with other JMP users.- User Community
- :
- Discussions
- :
- Cpk Analysis

- Mark as New
- Bookmark
- Subscribe
- Mute
- Subscribe to RSS Feed
- Get Direct Link
- Report Inappropriate Content
Cpk Analysis
| Example Dtata |
| 98.8 |
| 99.7 |
| 99.7 |
| 99.9 |
| 99.5 |
| 100.0 |
| 100.4 |
| 98.8 |
| 99.3 |
| 100.5 |
| 100.4 |
| 100.5 |
| 100.2 |
| 100.4 |
| 101.5 |
| 100.7 |
| 100.7 |
| 100.4 |
| 99.7 |
| 100.3 |
| 100.4 |
| 101.2 |
| 101.2 |
| 100.0 |
| 99.7 |
| 100.3 |
| 101.4 |
| 101.0 |
| 100.5 |
Kindly Help For Above Data.
I want to find Within sigma estimated by moving range & Cpk. Please Help me.
Accepted Solutions


- Mark as New
- Bookmark
- Subscribe
- Mute
- Subscribe to RSS Feed
- Get Direct Link
- Report Inappropriate Content
Re: Cpk Analysis
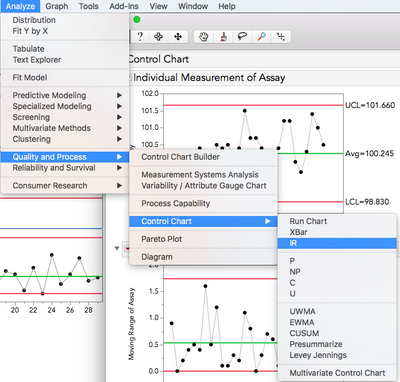
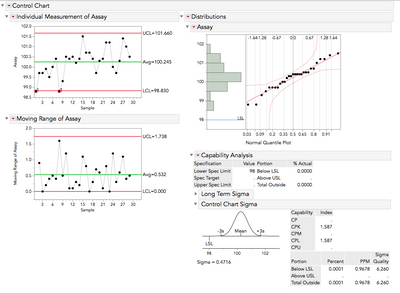
If I assume that you are dealing with a one sided specification of >98% Assay for instance I can use either Quality and Process Control Chart Builder or an IR/MR control chart under the Analyze>Quality and Process platform.

- Mark as New
- Bookmark
- Subscribe
- Mute
- Subscribe to RSS Feed
- Get Direct Link
- Report Inappropriate Content
Re: Cpk Analysis
I may have missed it, but do you have spec limits?
- Mark as New
- Bookmark
- Subscribe
- Mute
- Subscribe to RSS Feed
- Get Direct Link
- Report Inappropriate Content
Re: Cpk Analysis
Sprc Limit is 98 to 102.
For Within sigma JMP is using which Constant?
d2=? 1.1.28 or any other?
- Mark as New
- Bookmark
- Subscribe
- Mute
- Subscribe to RSS Feed
- Get Direct Link
- Report Inappropriate Content
Re: Cpk Analysis
If I assume that you are dealing with a one sided specification of >98% Assay for instance I can use either Quality and Process Control Chart Builder or an IR/MR control chart under the Analyze>Quality and Process platform.
- Mark as New
- Bookmark
- Subscribe
- Mute
- Subscribe to RSS Feed
- Get Direct Link
- Report Inappropriate Content
Re: Cpk Analysis
Thank you Mr Lou Valente For Reply.
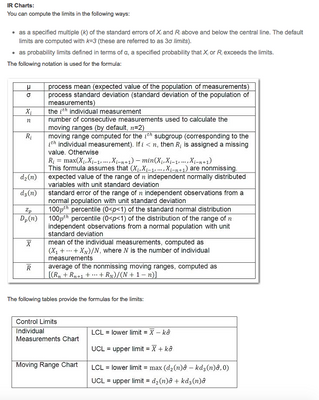
But My Question is For Within sigma JMP is using which Constant?
d2=? 1.1.28 or any other?
@Lou Valente

- Mark as New
- Bookmark
- Subscribe
- Mute
- Subscribe to RSS Feed
- Get Direct Link
- Report Inappropriate Content
Re: Cpk Analysis
If I may add a point here: If I assume your data is in time order (a requirement for a control chart), then you definitively have two populations in your data. The first 9 data points comprise one population and the remaining 20 points comprise the second. You can calculate Capability Indices for both populations separately, but to calculate a Capability for the entire data set is meaningless. Any process must be in a "reasonable degree of statistical control" before one can calculate meaningful Capability Indices. Your first question from this data set should be, "What happened to the process between somewhere around data points 9 and 10 that caused the process to shift upwards." If the special cause of the shift is a good thing, you need to understand what the cause is and modify the system to make this permanent.
I hope this helps.
- Mark as New
- Bookmark
- Subscribe
- Mute
- Subscribe to RSS Feed
- Get Direct Link
- Report Inappropriate Content
Re: Cpk Analysis
- Mark as New
- Bookmark
- Subscribe
- Mute
- Subscribe to RSS Feed
- Get Direct Link
- Report Inappropriate Content
Re: Cpk Analysis
For individuals/moving range charts, you should always use the following formulas for computing limits:
Limits for Individuals chart = average ± 2.66 * average moving range
Upper limit for mR chart = 3.268 * average moving range
As Dr. Wheeler says in his articles on the right and wrong ways to do control charts, "Accept no other limits".
Recommended Articles
- © 2026 JMP Statistical Discovery LLC. All Rights Reserved.
- Terms of Use
- Privacy Statement
- Contact Us