- New to JMP? Join us Sept. 23-24 for the Early User Edition of Discovery Summit, tailor-made for new users. Register now for free!
- Subscribe to RSS Feed
- Mark Topic as New
- Mark Topic as Read
- Float this Topic for Current User
- Bookmark
- Subscribe
- Mute
- Printer Friendly Page
Discussions
Solve problems, and share tips and tricks with other JMP users.- JMP User Community
- :
- Discussions
- :
- Re: Correlation with Non-Normal Data

- Mark as New
- Bookmark
- Subscribe
- Mute
- Subscribe to RSS Feed
- Get Direct Link
- Report Inappropriate Content
Correlation with Non-Normal Data
Hi JMP community,
I have a question about some data i'm analyzing for a research project. My project consists of a consensus ranking from 0-10 from multiple doctors and several parameters measured by a image analysis program. The image analysis program spits out parameters. I'm trying to find a correlation between any of the parameters and the consensus ranking from the doctors. I'm not much of a stats guy, but have a good idea of what I want to do. If you could help verify or correct me, then that would be great. These are all continuous measures.
1. I want to determine whether or not this data is normal. When I go to distribution for each of the parameters and the consensus rankings-->continuous fit-->normal--> goodness of fit I see that none of them are normal. Do I want to transform these? Or is it okay to analyze with non-normal data? I tried to remove some outliers and it didn't necessrily make it normal, and when I have never worked with transformed data.
2. What would be the best way to anaylze for correlation once its normal? Multiple linear regression? Multivariate methods?
I hope that this makes sense!
Thanks
Accepted Solutions

- Mark as New
- Bookmark
- Subscribe
- Mute
- Subscribe to RSS Feed
- Get Direct Link
- Report Inappropriate Content
Re: Correlation with Non-Normal Data
I want to be sure that I understand your situation. You have an ordinal response 0-10. You have several 'parameters' measured in image analysis. Are they continuous measurements or categorical values? You can use logistic regression to model and test the relationship. You define the linear predictor in this case the same way that you would for a continuous variable.
Select Analyze > Fit Model. Select response and click Y. Select data columns with image analysis parameters and click Add. (I assume only additive effects but if there is an indication of lack of fit, you could also add terms for interaction and non-linear effects.) Click Run.
1. What is the basis for the requirement for normality of the data?
2. Logistic regression.
- Mark as New
- Bookmark
- Subscribe
- Mute
- Subscribe to RSS Feed
- Get Direct Link
- Report Inappropriate Content
Re: Correlation with Non-Normal Data
Thanks for the reply! The parameters are continuous (things such as oxygen saturation levels).
I did the method you described, and seems like I've got the results I will need. I guess my confusion lied in the fact that I have some faint rememberance of conducting Spearman's Rho and Kendal's Tau when analyzing non-normal data, or thinking that there were different requirements to run the regression.
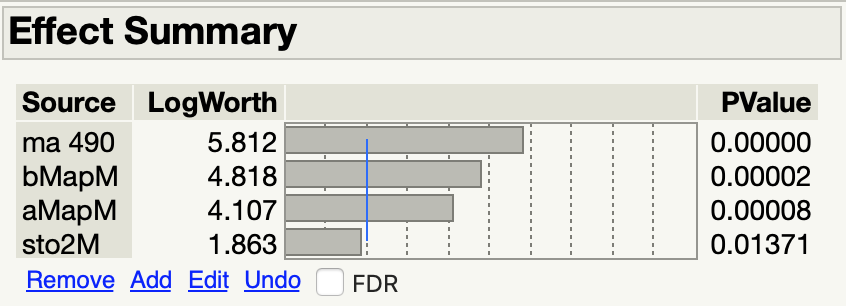
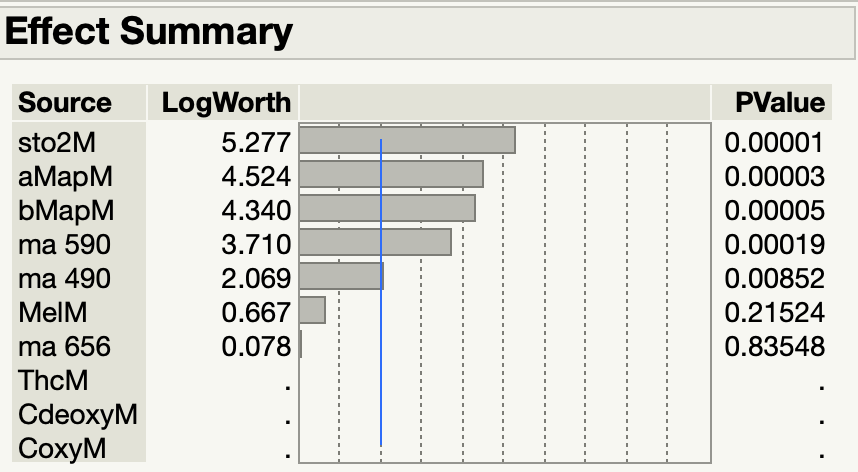
When doing the logistic regression as you mentioned, would I simply just interpret the results with P<.05 as significantly correlated? Additionally, when removing features that are insignificant, the significance increases for the others. I have attached images below showing this.
When trying to determine the correlation characteristics, i.e. positive or negative, r values, etc., is that best done looking at each parameter verse nominal response on a Y by X plot?
Thanks again for all your help, Mark.
- Mark as New
- Bookmark
- Subscribe
- Mute
- Subscribe to RSS Feed
- Get Direct Link
- Report Inappropriate Content
Re: Correlation with Non-Normal Data
The choice for statistical significance is up to you. The criterion of P-value < 0.05 is not universally acceptable.
Yes, the statistics, including p-values of any term depend on the other terms in the model. That is why they change when you add or remove a term. That is also why we recommend removing one term at a time (e.g., the one deemed least significant) and re-evaluate the new model estimates.
I think that the sign of the parameter estimate will tell you if the variable is associated with an increase or decrease in the log odds ratio.
- Mark as New
- Bookmark
- Subscribe
- Mute
- Subscribe to RSS Feed
- Get Direct Link
- Report Inappropriate Content
Re: Correlation with Non-Normal Data
Sorry, here were the images.


Recommended Articles
- © 2026 JMP Statistical Discovery LLC. All Rights Reserved.
- Terms of Use
- Privacy Statement
- Contact Us