Turn on suggestions
Auto-suggest helps you quickly narrow down your search results by suggesting possible matches as you type.
- Don’t miss your chance to experience Discovery Summit Europe at our best available rate! Early bird registration through 31 Oct.
- Graph Builder Toolbar streamlines interactive graphing. Creates shortcuts on Report and GraphBuilder Helpers toolbars. Download and install the extension.
Options
- Subscribe to RSS Feed
- Mark Topic as New
- Mark Topic as Read
- Float this Topic for Current User
- Bookmark
- Subscribe
- Mute
- Printer Friendly Page
Discussions
Solve problems, and share tips and tricks with other JMP users.- User Community
- :
- Discussions
- :
- Re: Contour Plot arrange by Row

Level V
- Mark as New
- Bookmark
- Subscribe
- Mute
- Subscribe to RSS Feed
- Get Direct Link
- Report Inappropriate Content
Contour Plot arrange by Row
Created:
Oct 11, 2020 06:58 AM
| Last Modified: Jun 11, 2023 4:06 AM
(3147 views)
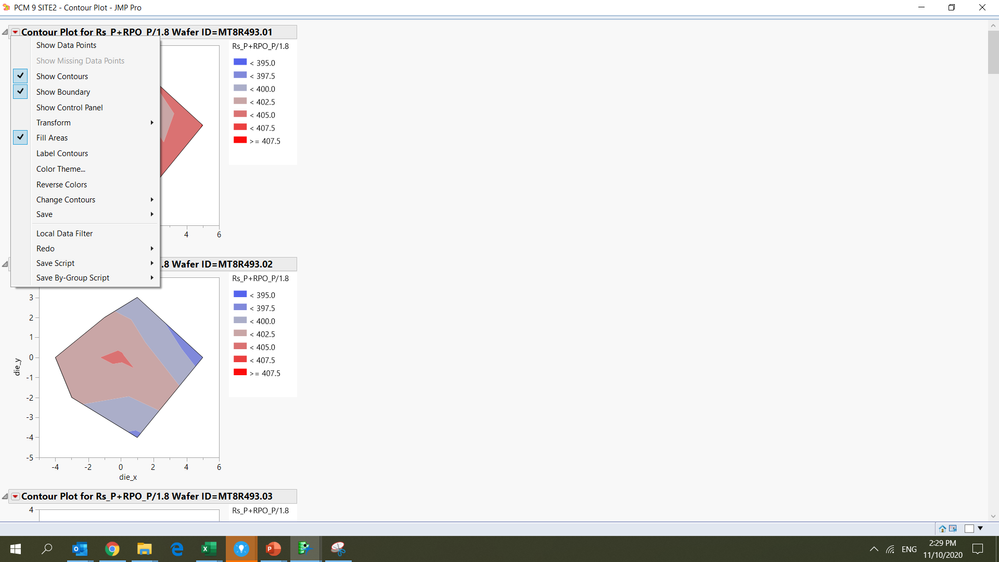
I want to plot contour plot arrange by row group by Wafer ID. By default, the graph will be arrange in columns. Is there a way to display the graph in n rows and n columns that i like?
1 ACCEPTED SOLUTION
Accepted Solutions


Super User
Solution
- Mark as New
- Bookmark
- Subscribe
- Mute
- Subscribe to RSS Feed
- Get Direct Link
- Report Inappropriate Content
Re: Contour Plot arrange by Row
Here are 2 ways to do it. The first is to place a simple window around the output and specify to use a H List Box() to arrange the different graphs.
The second is to use Graph Builder, and the built in capabilities of that platform.
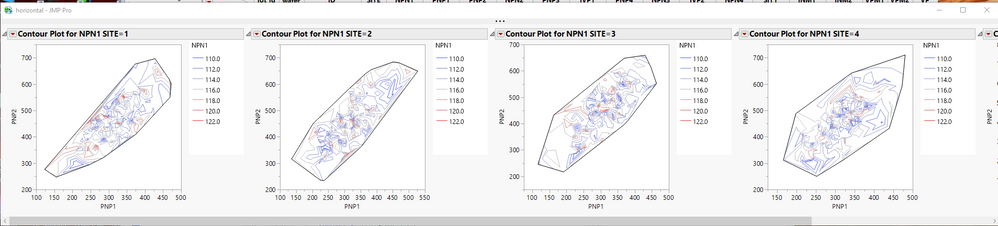
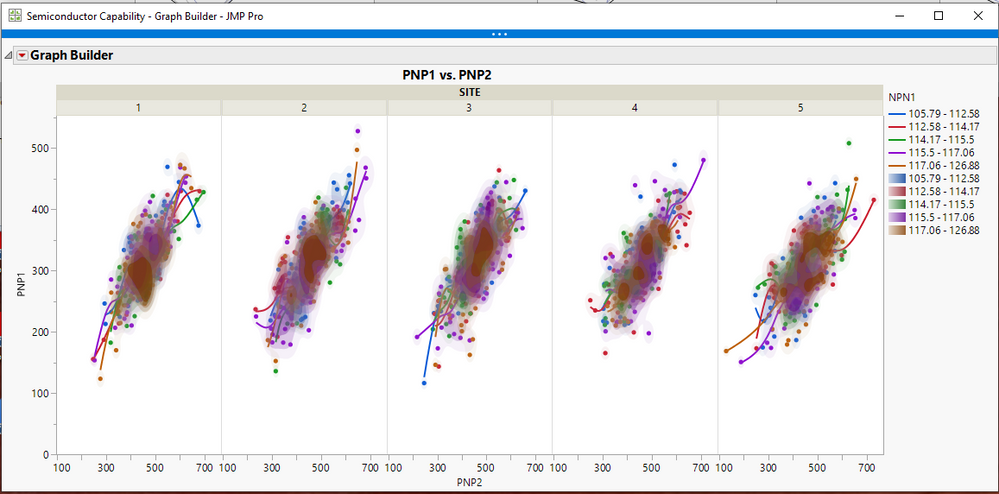
Names Default to Here(1);
dt = Open("$SAMPLE_DATA/semiconductor capability.jmp");

New Window( "horizontal",
	H List Box(
		Contour Plot(
			X( :PNP1, :PNP2 ),
			Y( :NPN1 ),
			Show Data Points( 0 ),
			Fill Areas( 0 ),
			Label Contours( 0 ),
			Transform( "Range Normalized" ),
			Specify Contours(
				Min( 110 ),
				Max( 122 ),
				N( 7 )
			),
			by( :site )
		)
	)
);

// or with Graph Builder
Graph Builder(
	Size( 1009, 492 ),
	Show Control Panel( 0 ),
	Variables( X( :PNP2 ), Y( :PNP1 ), Group X( :SITE ), Overlay( :NPN1 ) ),
	Elements(
		Points( X, Y, Legend( 3 ) ),
		Smoother( X, Y, Legend( 4 ) ),
		Contour( X, Y, Legend( 5 ) )
	)
);
Jim
1 REPLY 1
Super User
Solution
- Mark as New
- Bookmark
- Subscribe
- Mute
- Subscribe to RSS Feed
- Get Direct Link
- Report Inappropriate Content
Re: Contour Plot arrange by Row
Here are 2 ways to do it. The first is to place a simple window around the output and specify to use a H List Box() to arrange the different graphs.
The second is to use Graph Builder, and the built in capabilities of that platform.
Names Default to Here(1);
dt = Open("$SAMPLE_DATA/semiconductor capability.jmp");

New Window( "horizontal",
	H List Box(
		Contour Plot(
			X( :PNP1, :PNP2 ),
			Y( :NPN1 ),
			Show Data Points( 0 ),
			Fill Areas( 0 ),
			Label Contours( 0 ),
			Transform( "Range Normalized" ),
			Specify Contours(
				Min( 110 ),
				Max( 122 ),
				N( 7 )
			),
			by( :site )
		)
	)
);

// or with Graph Builder
Graph Builder(
	Size( 1009, 492 ),
	Show Control Panel( 0 ),
	Variables( X( :PNP2 ), Y( :PNP1 ), Group X( :SITE ), Overlay( :NPN1 ) ),
	Elements(
		Points( X, Y, Legend( 3 ) ),
		Smoother( X, Y, Legend( 4 ) ),
		Contour( X, Y, Legend( 5 ) )
	)
);
Jim
Recommended Articles
- © 2026 JMP Statistical Discovery LLC. All Rights Reserved.
- Terms of Use
- Privacy Statement
- Contact Us