- Don’t miss your chance to experience Discovery Summit Europe at our best available rate! Early bird registration through 31 Oct.
- Graph Builder Toolbar streamlines interactive graphing. Creates shortcuts on Report and GraphBuilder Helpers toolbars. Download and install the extension.
- JMP will suspend normal business operations for our Rest and Recharge Day on Friday, October 2, 2026.
Regular business hours will resume on Monday, October 5, 2026.
- Subscribe to RSS Feed
- Mark Topic as New
- Mark Topic as Read
- Float this Topic for Current User
- Bookmark
- Subscribe
- Mute
- Printer Friendly Page
Discussions
Solve problems, and share tips and tricks with other JMP users.- User Community
- :
- Discussions
- :
- Re: Connect line in graph builder on certain points only

- Mark as New
- Bookmark
- Subscribe
- Mute
- Subscribe to RSS Feed
- Get Direct Link
- Report Inappropriate Content
Connect line in graph builder on certain points only
Hi all,
In attached you see in the first column 40 values. Working down by row you see the values are labelled as replicate 1 or replicate 2 (these are values from duplicate measurements).
My wish was to connect with a line each pair of duplicate values; this is seen in the graph "Connected". To do this I ran the script below to add rows and then choose the option "No connection" for missing values. (The fourth and fifth columns in the attached data table.)
Is there an easier way to do this? Graph builder can do so many things and may well offer a more direct/easier way to achieve what I was seeking to achieve.
Many thanks, Scott.
Names Default To Here(1);

dt = Current Data Table();
intCounter=2;

For(i=1,i<=19,i++,

	dt << Add Rows( 1, after( intCounter ) );
	intCounter = intCounter + 3;

);
Accepted Solutions


- Mark as New
- Bookmark
- Subscribe
- Mute
- Subscribe to RSS Feed
- Get Direct Link
- Report Inappropriate Content
Re: Connect line in graph builder on certain points only
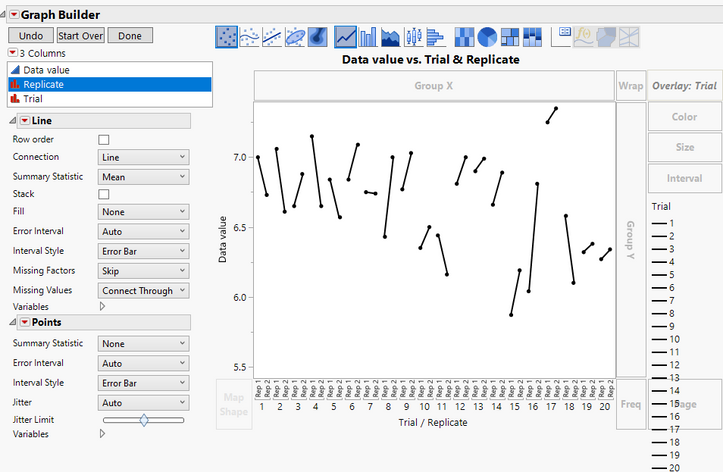
If you add a "Trial" column to your data table, then there are at least 2 ways to do this.
The Graph Builder can do it (it defaults to a separate color for each trial; I selected all, then broadcast a color change to black):
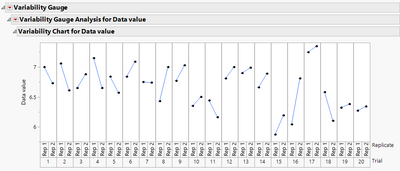
The Variability Chart in the 'Quality and Process' menu has this functionality built in.
I attached an updated copy of your data table with scripts saved for each method.
- Mark as New
- Bookmark
- Subscribe
- Mute
- Subscribe to RSS Feed
- Get Direct Link
- Report Inappropriate Content
Re: Connect line in graph builder on certain points only
If you add a "Trial" column to your data table, then there are at least 2 ways to do this.
The Graph Builder can do it (it defaults to a separate color for each trial; I selected all, then broadcast a color change to black):
The Variability Chart in the 'Quality and Process' menu has this functionality built in.
I attached an updated copy of your data table with scripts saved for each method.
- Mark as New
- Bookmark
- Subscribe
- Mute
- Subscribe to RSS Feed
- Get Direct Link
- Report Inappropriate Content
Re: Connect line in graph builder on certain points only
Many thanks, Jed.
Recommended Articles
- © 2026 JMP Statistical Discovery LLC. All Rights Reserved.
- Terms of Use
- Privacy Statement
- Contact Us