- Subscribe to RSS Feed
- Mark Topic as New
- Mark Topic as Read
- Float this Topic for Current User
- Bookmark
- Subscribe
- Mute
- Printer Friendly Page
Discussions
Solve problems, and share tips and tricks with other JMP users.- JMP User Community
- :
- Discussions
- :
- Colors of bivariate fit
- Mark as New
- Bookmark
- Subscribe
- Mute
- Subscribe to RSS Feed
- Get Direct Link
- Report Inappropriate Content
Colors of bivariate fit
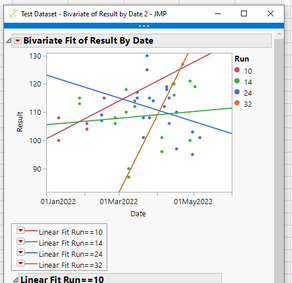
Hi, I plot a bivariate fit and fit a linear line for each "run". The colors on the row legend match the colors of the linear fit lines (see pic 1)
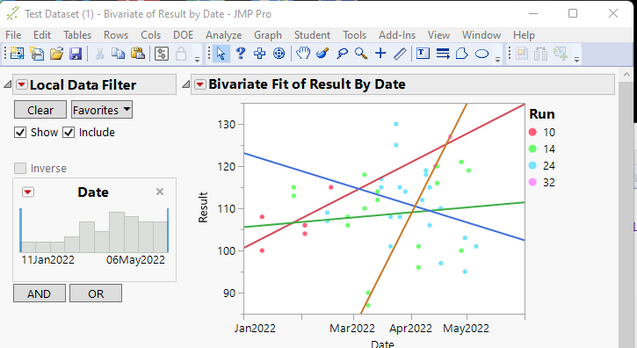
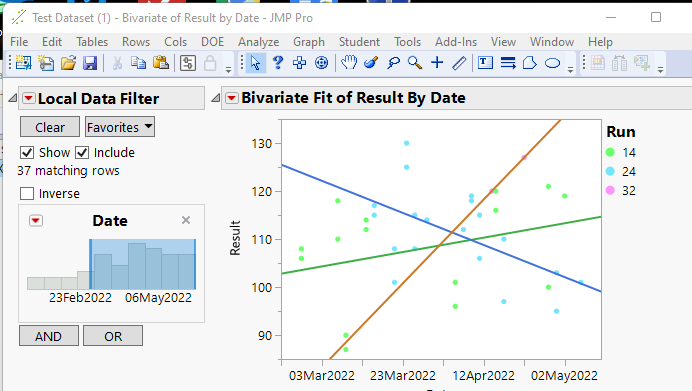
When I apply a local data filter and change the "Date" and therefore the "Run" may change, the colors on the row legend do now match with the colors of the linear fit lines. See pic 2, the Run 14 is red dots but the linear fit line is green.
Is there any way that the row legend and linear fit line can always be the same? I have attached the data table and script.
picture 1: colors in the row legend match with the colors in the linear fit line.
picture 2: colors in the row legend do not match with the colors in the linear fit line.
Accepted Solutions
- Mark as New
- Bookmark
- Subscribe
- Mute
- Subscribe to RSS Feed
- Get Direct Link
- Report Inappropriate Content
Re: Colors of bivariate fit
You are removing the selection of the Value Color when you are specifying the Line Color on the Fit Where. Below is an example where the colors remain the same
Names Default To Here( 1 );
dt = Current Data Table();
Show( :Run << get property( "Value Colors" ) );
:Run << set property( "Value Colors", {"10" = 35, "14" = 68, "24" = 77, "32" = 75} );
:Run << color cell by value( 1 );
Show( :Run << get property( "Value Colors" ) );


Bivariate(
	Y( :Result ),
	X( :Date ),
	Fit Where( :Run == "10", Fit Line() ),
	Fit Where( :Run == "14", Fit Line() ),
	Fit Where( :Run == "24", Fit Line() ),
	Fit Where( :Run == "32", Fit Line() ),
	Local Data Filter(

		Add Filter(
			columns( :Date ),
			Where( :Date >= 12Mar2022:05:43:20 & :Date <= 06May2022 )
		)
	),
	SendToReport(
		Dispatch(
			{},
			"Bivar Plot",
			FrameBox,
			{Row Legend(
				Run,
				Color( 1 ),
				Color Theme( "" ),
				Marker( 0 ),
				Marker Theme( "" ),
				Continuous Scale( 0 ),
				Reverse Scale( 0 ),
				Excluded Rows( 0 )
			)}
		)
	)
);- Mark as New
- Bookmark
- Subscribe
- Mute
- Subscribe to RSS Feed
- Get Direct Link
- Report Inappropriate Content
Re: Colors of bivariate fit
Set the Column Property, Value Colors for the Run column, and when the local filter changes, it will always use the Value Colors set for each llevel of the Run column.
- Mark as New
- Bookmark
- Subscribe
- Mute
- Subscribe to RSS Feed
- Get Direct Link
- Report Inappropriate Content
Re: Colors of bivariate fit
I think that I am still doing something wrong. This is the code that I am using. The data table is attached to the first post in this tread. When I move the local data filter by date, one of the Runs disappears and the colours change. What am I doing wrong?
dt = Current Data Table();
Show( :Run << get property( "Value Colors" ) );
:Run << set property( "Value Colors", {} );
:Run << color cell by value( 1 );
Show( :Run << get property( "Value Colors" ) );


Bivariate(
	Y( :Result ),
	X( :Date ),
	Fit Where( :Run == "10", Fit Line( {Line Color( {} )} ) ),
	Fit Where( :Run == "14", Fit Line( {Line Color( {} )} ) ),
	Fit Where( :Run == "24", Fit Line( {Line Color( {} )} ) ),
	Fit Where( :Run == "32", Fit Line( {Line Color( {} )} ) ),
	Local Data Filter(

		Add Filter(
			columns( :Date ),
			Where( :Date >= 12Mar2022:05:43:20 & :Date <= 06May2022 )
		)
	),
	SendToReport(
		Dispatch(
			{},
			"Bivar Plot",
			FrameBox,
			{Row Legend(
				Run,
				Color( 1 ),
				Color Theme( "" ),
				Marker( 0 ),
				Marker Theme( "" ),
				Continuous Scale( 0 ),
				Reverse Scale( 0 ),
				Excluded Rows( 0 )
			)}
		)
	)
);- Mark as New
- Bookmark
- Subscribe
- Mute
- Subscribe to RSS Feed
- Get Direct Link
- Report Inappropriate Content
Re: Colors of bivariate fit
You are removing the selection of the Value Color when you are specifying the Line Color on the Fit Where. Below is an example where the colors remain the same
Names Default To Here( 1 );
dt = Current Data Table();
Show( :Run << get property( "Value Colors" ) );
:Run << set property( "Value Colors", {"10" = 35, "14" = 68, "24" = 77, "32" = 75} );
:Run << color cell by value( 1 );
Show( :Run << get property( "Value Colors" ) );


Bivariate(
	Y( :Result ),
	X( :Date ),
	Fit Where( :Run == "10", Fit Line() ),
	Fit Where( :Run == "14", Fit Line() ),
	Fit Where( :Run == "24", Fit Line() ),
	Fit Where( :Run == "32", Fit Line() ),
	Local Data Filter(

		Add Filter(
			columns( :Date ),
			Where( :Date >= 12Mar2022:05:43:20 & :Date <= 06May2022 )
		)
	),
	SendToReport(
		Dispatch(
			{},
			"Bivar Plot",
			FrameBox,
			{Row Legend(
				Run,
				Color( 1 ),
				Color Theme( "" ),
				Marker( 0 ),
				Marker Theme( "" ),
				Continuous Scale( 0 ),
				Reverse Scale( 0 ),
				Excluded Rows( 0 )
			)}
		)
	)
);- Mark as New
- Bookmark
- Subscribe
- Mute
- Subscribe to RSS Feed
- Get Direct Link
- Report Inappropriate Content
Re: Colors of bivariate fit
Worked like a charm, thank you!
Recommended Articles
- © 2026 JMP Statistical Discovery LLC. All Rights Reserved.
- Terms of Use
- Privacy Statement
- Contact Us


