- Don’t miss your chance to experience Discovery Summit Europe at our best available rate! Early bird registration through 31 Oct.
- Image to Table JMP extension imports single or batch images as data tables. Useful to extract curves from pictures or convert image data to curve data to use in analyses like Functional Data Explorer. Download and install the extension.
- Subscribe to RSS Feed
- Mark Topic as New
- Mark Topic as Read
- Float this Topic for Current User
- Bookmark
- Subscribe
- Mute
- Printer Friendly Page
Discussions
Solve problems, and share tips and tricks with other JMP users.- User Community
- :
- Discussions
- :
- Clustered bar chart - standard error bars disappear

- Mark as New
- Bookmark
- Subscribe
- Mute
- Subscribe to RSS Feed
- Get Direct Link
- Report Inappropriate Content
Clustered bar chart - standard error bars disappear
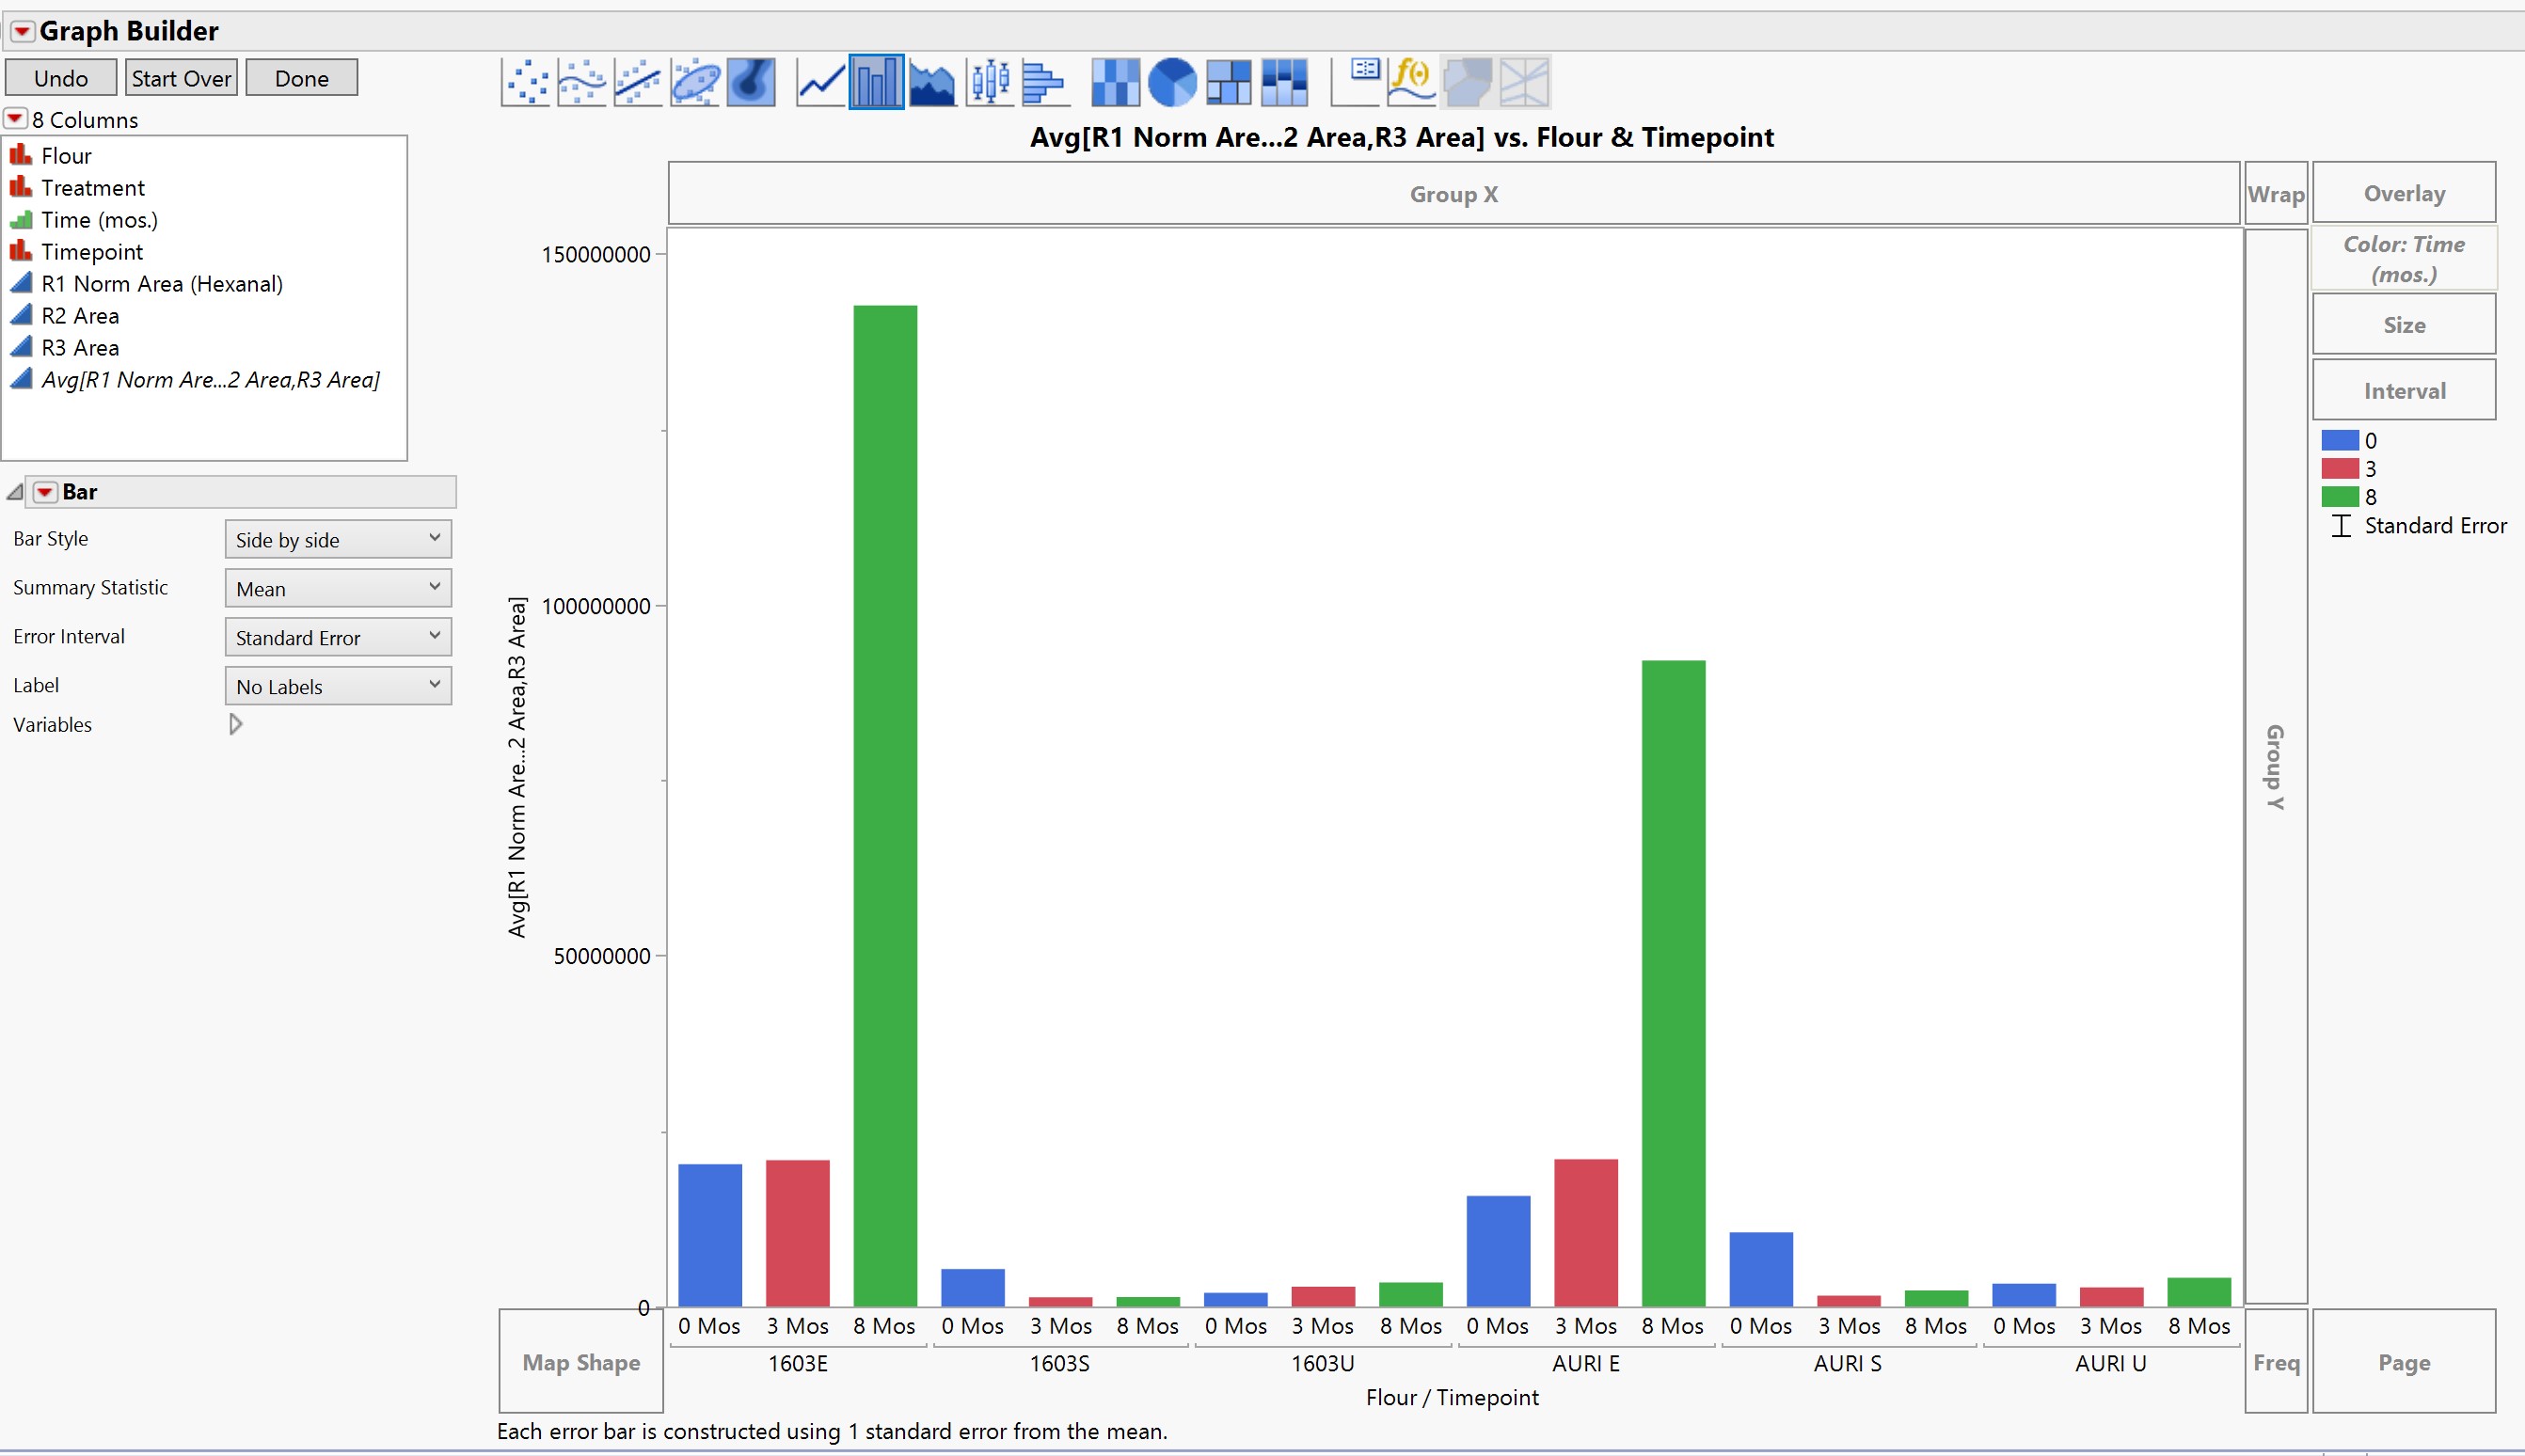
I'm not sure what's going on with my dataset, but I can see standard error bars on my graph when I just have the averages plotted against the flour type. The standard error bars disappear when I then add the timepoint ordinal variable in. Do I need to separate the 3 timepoints into separate columns in the dataset, or is there something else that's going wrong? Thanks!
Accepted Solutions


- Mark as New
- Bookmark
- Subscribe
- Mute
- Subscribe to RSS Feed
- Get Direct Link
- Report Inappropriate Content
Re: Clustered bar chart - standard error bars disappear
I think you only have one data point for each group Flour + Timepoint, so there is no error to be calculated.
For example in this graph 17/F has no error bar because LINDA is the only row in that group:


- Mark as New
- Bookmark
- Subscribe
- Mute
- Subscribe to RSS Feed
- Get Direct Link
- Report Inappropriate Content
Re: Clustered bar chart - standard error bars disappear
Ah... didn't notice you had three "different" y-axis. I'm not exactly sure how JMP will calculate them in that case when you combine them like that. You could first try stacking the data by those R1-R3 columns and try to plot again.
- Mark as New
- Bookmark
- Subscribe
- Mute
- Subscribe to RSS Feed
- Get Direct Link
- Report Inappropriate Content
Re: Clustered bar chart - standard error bars disappear
I think you only have one data point for each group Flour + Timepoint, so there is no error to be calculated.
For example in this graph 17/F has no error bar because LINDA is the only row in that group:
- Mark as New
- Bookmark
- Subscribe
- Mute
- Subscribe to RSS Feed
- Get Direct Link
- Report Inappropriate Content
Re: Clustered bar chart - standard error bars disappear
This makes sense, however, I have 2-3 data points for almost every code in Flour+Timepoint (the R1/R2/R3 columns). I'm having a hard time getting JMP to calculate the average and put it into a single bar. Could this be my issue with lumping them altogether into one variable (the average of the 3 columns)?
- Mark as New
- Bookmark
- Subscribe
- Mute
- Subscribe to RSS Feed
- Get Direct Link
- Report Inappropriate Content
Re: Clustered bar chart - standard error bars disappear
Ah... didn't notice you had three "different" y-axis. I'm not exactly sure how JMP will calculate them in that case when you combine them like that. You could first try stacking the data by those R1-R3 columns and try to plot again.
- Mark as New
- Bookmark
- Subscribe
- Mute
- Subscribe to RSS Feed
- Get Direct Link
- Report Inappropriate Content
Re: Clustered bar chart - standard error bars disappear
Thank you so much! It worked perfectly to put in the standard errors as applicable to my data.
Recommended Articles
- © 2026 JMP Statistical Discovery LLC. All Rights Reserved.
- Terms of Use
- Privacy Statement
- Contact Us