- JMP Statement Regarding Critical PHP Remote Code Execution Vulnerabilities (CVE-2026-109618, CVE-2026-109619)
- Don’t miss your chance to experience Discovery Summit Europe at our best available rate! Early bird registration through 31 Oct.
- Graph Builder Toolbar streamlines interactive graphing. Creates shortcuts on Report and GraphBuilder Helpers toolbars. Download and install the extension.
- Subscribe to RSS Feed
- Mark Topic as New
- Mark Topic as Read
- Float this Topic for Current User
- Bookmark
- Subscribe
- Mute
- Printer Friendly Page
Discussions
Solve problems, and share tips and tricks with other JMP users.- User Community
- :
- Discussions
- :
- Re: Clustered bar chart - standard error bars disappear

- Mark as New
- Bookmark
- Subscribe
- Mute
- Subscribe to RSS Feed
- Get Direct Link
- Report Inappropriate Content
Clustered bar chart - standard error bars disappear
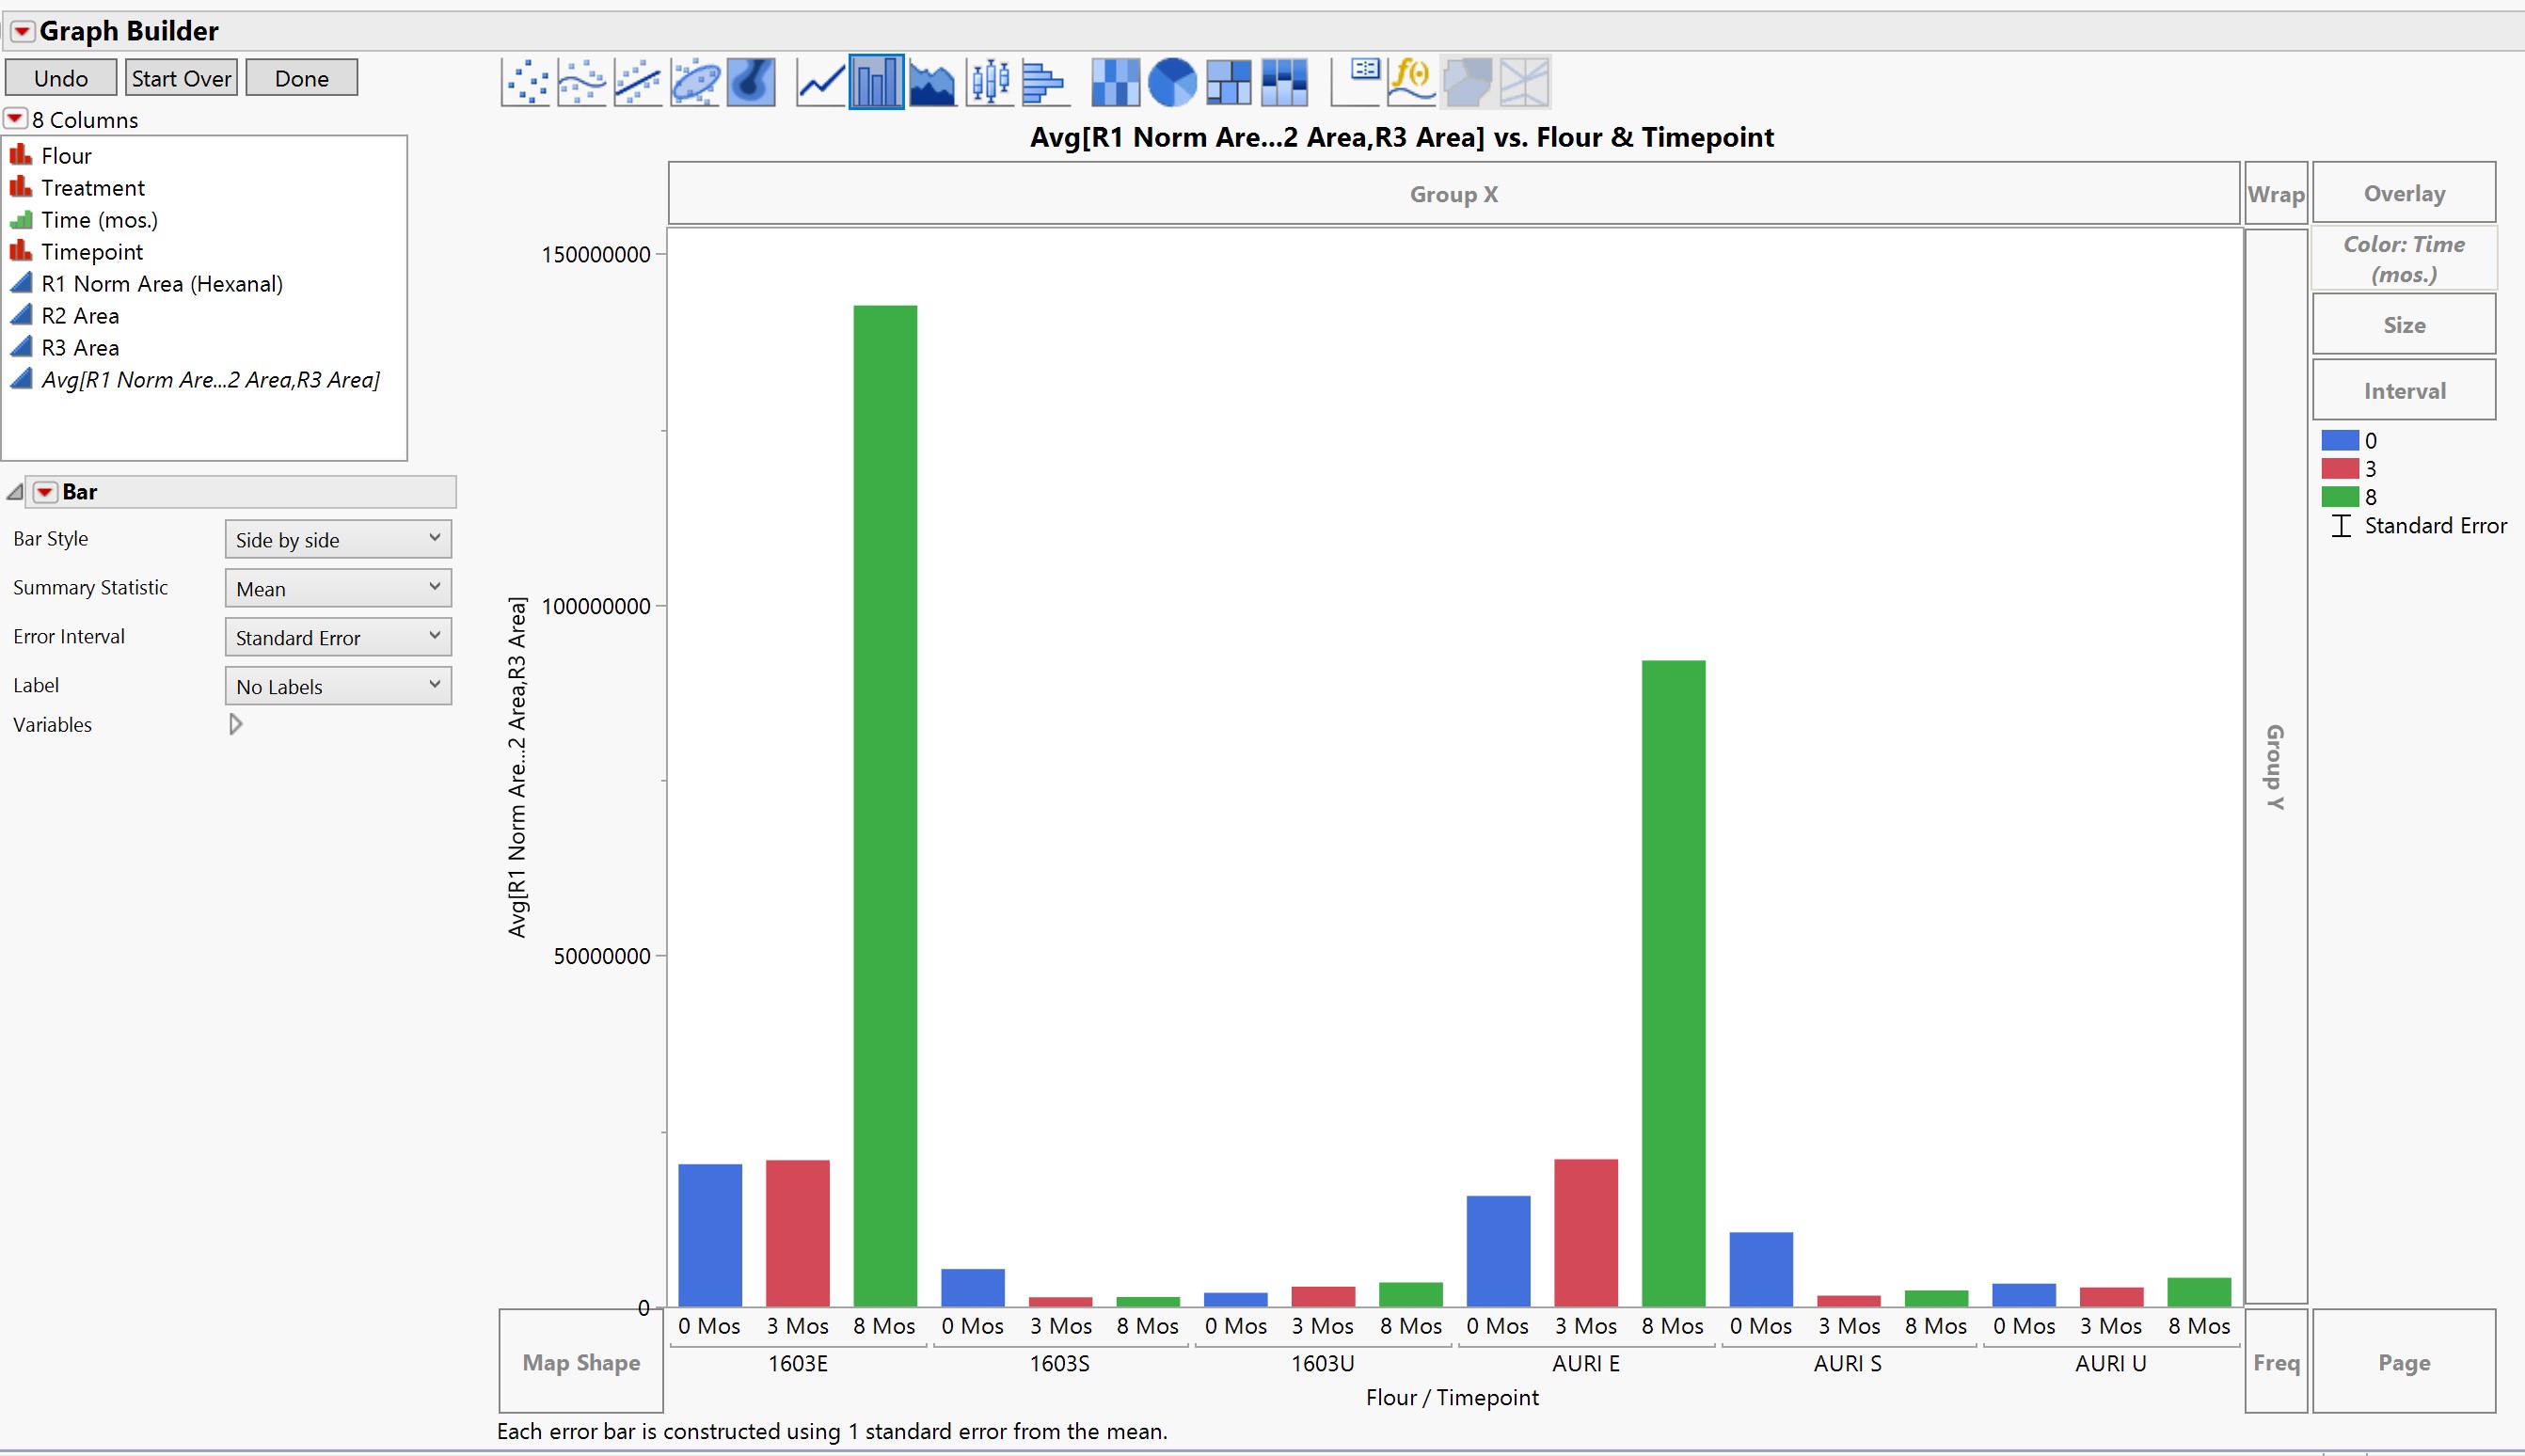
I'm not sure what's going on with my dataset, but I can see standard error bars on my graph when I just have the averages plotted against the flour type. The standard error bars disappear when I then add the timepoint ordinal variable in. Do I need to separate the 3 timepoints into separate columns in the dataset, or is there something else that's going wrong? Thanks!
Accepted Solutions


- Mark as New
- Bookmark
- Subscribe
- Mute
- Subscribe to RSS Feed
- Get Direct Link
- Report Inappropriate Content
Re: Clustered bar chart - standard error bars disappear
I think you only have one data point for each group Flour + Timepoint, so there is no error to be calculated.
For example in this graph 17/F has no error bar because LINDA is the only row in that group:


- Mark as New
- Bookmark
- Subscribe
- Mute
- Subscribe to RSS Feed
- Get Direct Link
- Report Inappropriate Content
Re: Clustered bar chart - standard error bars disappear
Ah... didn't notice you had three "different" y-axis. I'm not exactly sure how JMP will calculate them in that case when you combine them like that. You could first try stacking the data by those R1-R3 columns and try to plot again.
- Mark as New
- Bookmark
- Subscribe
- Mute
- Subscribe to RSS Feed
- Get Direct Link
- Report Inappropriate Content
Re: Clustered bar chart - standard error bars disappear
I think you only have one data point for each group Flour + Timepoint, so there is no error to be calculated.
For example in this graph 17/F has no error bar because LINDA is the only row in that group:
- Mark as New
- Bookmark
- Subscribe
- Mute
- Subscribe to RSS Feed
- Get Direct Link
- Report Inappropriate Content
Re: Clustered bar chart - standard error bars disappear
This makes sense, however, I have 2-3 data points for almost every code in Flour+Timepoint (the R1/R2/R3 columns). I'm having a hard time getting JMP to calculate the average and put it into a single bar. Could this be my issue with lumping them altogether into one variable (the average of the 3 columns)?
- Mark as New
- Bookmark
- Subscribe
- Mute
- Subscribe to RSS Feed
- Get Direct Link
- Report Inappropriate Content
Re: Clustered bar chart - standard error bars disappear
Ah... didn't notice you had three "different" y-axis. I'm not exactly sure how JMP will calculate them in that case when you combine them like that. You could first try stacking the data by those R1-R3 columns and try to plot again.
- Mark as New
- Bookmark
- Subscribe
- Mute
- Subscribe to RSS Feed
- Get Direct Link
- Report Inappropriate Content
Re: Clustered bar chart - standard error bars disappear
Thank you so much! It worked perfectly to put in the standard errors as applicable to my data.
Recommended Articles
- © 2026 JMP Statistical Discovery LLC. All Rights Reserved.
- Terms of Use
- Privacy Statement
- Contact Us