Turn on suggestions
Auto-suggest helps you quickly narrow down your search results by suggesting possible matches as you type.
- Instantly extract effect sizes, F-ratios, and FDR-adjusted p-values from your models with the Calculate Effects Sizes extension, available now in the JMP Marketplace!
- New to JMP? Join us Sept. 23-24 for the Early User Edition of Discovery Summit, tailor-made for new users. Register now for free!
- Your voice matters! Tell us how you prefer to receive JMP updates, so we can tailor our communication to your needs. Take short survey.
Options
- Subscribe to RSS Feed
- Mark Topic as New
- Mark Topic as Read
- Float this Topic for Current User
- Bookmark
- Subscribe
- Mute
- Printer Friendly Page
Discussions
Solve problems, and share tips and tricks with other JMP users.- JMP User Community
- :
- Discussions
- :
- Re: Calculate Rate of Change Grouped by Column

Level IV
- Mark as New
- Bookmark
- Subscribe
- Mute
- Subscribe to RSS Feed
- Get Direct Link
- Report Inappropriate Content
Calculate Rate of Change Grouped by Column
Mar 31, 2020 04:25 PM
(6534 views)
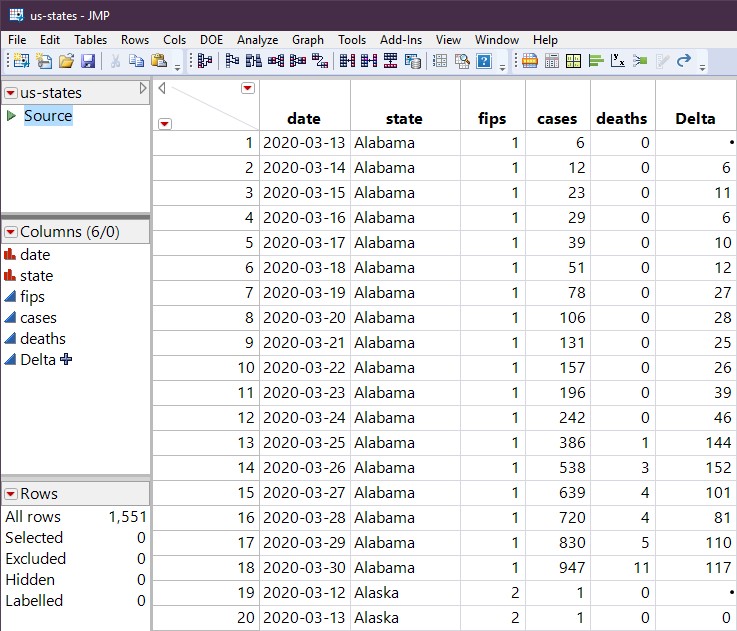
I, like many others I suppose, are looking at the COVID-19 data (I got mine from https://raw.githubusercontent.com/nytimes/covid-19-data/master/us-states.csv). I would like to plot the daily change in confirmed cases by State. I've been able to work it out by first sorting the data by State, and then calculating the deltas:
If(:state == Lag(:state, 1),
	:cases - Lag(:cases, 1)
)
But is there any way to do this without sorting the data first, using some kind of Group By formulation?
1 ACCEPTED SOLUTION
Accepted Solutions

Super User
Solution
- Mark as New
- Bookmark
- Subscribe
- Mute
- Subscribe to RSS Feed
- Get Direct Link
- Report Inappropriate Content
Re: Calculate Rate of Change Grouped by Column
Created:
Mar 31, 2020 04:51 PM
| Last Modified: Mar 31, 2020 2:02 PM
(6528 views)
| Posted in reply to message from MarkDayton 03-31-2020
Something like this might work.....but it will be slow if you have a lot of data
dt = Current Data Table();
curDate = :Date;
curState = :State;
Try( :cases - :cases[(dt < get rows where( :date == (curDate - In Days( 1 )) & :State == curState ))[1]] );
Jim
3 REPLIES 3
Super User
Solution
- Mark as New
- Bookmark
- Subscribe
- Mute
- Subscribe to RSS Feed
- Get Direct Link
- Report Inappropriate Content
Re: Calculate Rate of Change Grouped by Column
Created:
Mar 31, 2020 04:51 PM
| Last Modified: Mar 31, 2020 2:02 PM
(6529 views)
| Posted in reply to message from MarkDayton 03-31-2020
Something like this might work.....but it will be slow if you have a lot of data
dt = Current Data Table();
curDate = :Date;
curState = :State;
Try( :cases - :cases[(dt < get rows where( :date == (curDate - In Days( 1 )) & :State == curState ))[1]] );
Jim
Level IV
- Mark as New
- Bookmark
- Subscribe
- Mute
- Subscribe to RSS Feed
- Get Direct Link
- Report Inappropriate Content
Re: Calculate Rate of Change Grouped by Column
Created:
Mar 31, 2020 05:36 PM
| Last Modified: Mar 31, 2020 2:38 PM
(6516 views)
| Posted in reply to message from txnelson 03-31-2020
With one correction, change from: "dt < get rows", to: "dt << get rows"
Super User
- Mark as New
- Bookmark
- Subscribe
- Mute
- Subscribe to RSS Feed
- Get Direct Link
- Report Inappropriate Content
Re: Calculate Rate of Change Grouped by Column
oops....my error......good catch
Jim
Recommended Articles
- © 2026 JMP Statistical Discovery LLC. All Rights Reserved.
- Terms of Use
- Privacy Statement
- Contact Us