Turn on suggestions
Auto-suggest helps you quickly narrow down your search results by suggesting possible matches as you type.
Options
- Subscribe to RSS Feed
- Mark Topic as New
- Mark Topic as Read
- Float this Topic for Current User
- Bookmark
- Subscribe
- Mute
- Printer Friendly Page
Discussions
Solve problems, and share tips and tricks with other JMP users.- JMP User Community
- :
- Discussions
- :
- Box plot show Different Spec line in a graph by JSL
- Mark as New
- Bookmark
- Subscribe
- Mute
- Subscribe to RSS Feed
- Get Direct Link
- Report Inappropriate Content
Box plot show Different Spec line in a graph by JSL
Apr 13, 2024 08:20 AM
(1766 views)
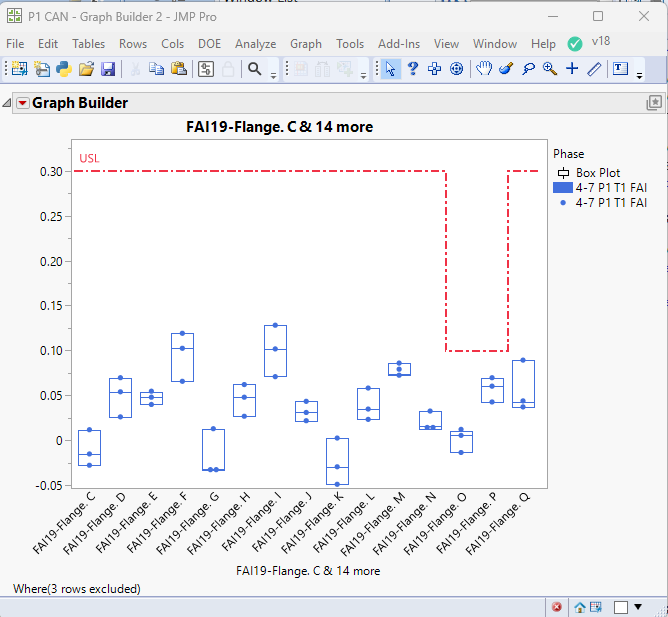
As the document 《P1 CAN.jmp》, the graph "FAI 19-Flange" box plot is created by 《Direct create Boxplot.jsl》, this method does not need to stack data table, but the Spec line is the same Horizontal line. Now, I want to show it as 《Box Plot.jpg》by Different Spec line, and this method was created by manual operation, it needs to stack data table, how to correct 《Direct create Boxplot.jsl》can auto create?
1 ACCEPTED SOLUTION
Accepted Solutions
- Mark as New
- Bookmark
- Subscribe
- Mute
- Subscribe to RSS Feed
- Get Direct Link
- Report Inappropriate Content
Re: Box plot show Different Spec line in a graph by JSL
Is this what you want
names default to here(1);
dt = current data table();
colNamesX = dt << get column names(string);
for(i=nitems(colNamesX),i>=1,i--,
	if(contains(colNamesX[i],"Flange")==0,
		remove from(colNamesX,i,1),
		word(4,colNamesX[i],"-.")!="",
			remove from(colNamesX,i,1)
	)
);
colNameColor = column(1)<<get name;

theExpr =
"gb = dt << Graph Builder(
	Size( 534, 464 ),
	Show Control Panel( 0 ),
	Variables(";
for each( {col,index}, colNamesX,
	theExpr = theExpr ||
		"X( :\!"" || col || "\!"n, Position( 1 ) ),";
);
theExpr = theExpr ||
	"Color( :\!"" || colNameColor || "\!"n )
	),
	Elements(
		Box Plot(";
for each( {col,index}, colNamesX,
	theExpr = theExpr ||
		"X( " || char(index) || " ),";
);
theExpr = theExpr ||
	"Legend( 3 )
		),
		Points(";
for each( {col,index}, colNamesX,
	theExpr = theExpr ||
		"X( " || char(index) || " ),";
);
theExpr = theExpr ||
	"Legend( 4 )
		)
	)
);";

// Generate the graph
eval(parse(theExpr));

// Add the USL line
// Find the USL row
theUSLRow = (dt << get rows where(:Phase == "USL"))[1];

// Get the values
USLs = [];
For Each( {col}, colNamesX,
	USLs = USLs || matrix(as column(dt,col)[theUSLRow])
);

// Set the Y axis upper value
report( gb )[AxisBox(2)] << Max(max(USLs)+.1*(max(USLs)-(report( gb )[AxisBox(2)] << get min)));

report( gb )[FrameBox(1)] << Add Graphics Script(
	Pen Color( "red");
	Pen Size( 2 );
	Line Style( "DashDot");

	matX = [];
	For(i=0,i<=length(USLs)-1,i++,
		matX = matX || matrix(i-.5) || matrix( i+.5);
	);
	matY = [];
	For(i=1,i<=length(USLs),i++,
		matY = matY || USLs[i] || USLs[i];
	);
	Line(matX,matY);
	Text Color( "red" );
	textPos = {0};
	insert into(textPos,Max(max(USLs)+.025*(max(USLs)-(report( gb )[AxisBox(2)] << get min))));
	Text( Center Justified, eval(textPos), "USL" );
);
Jim
1 REPLY 1
- Mark as New
- Bookmark
- Subscribe
- Mute
- Subscribe to RSS Feed
- Get Direct Link
- Report Inappropriate Content
Re: Box plot show Different Spec line in a graph by JSL
Is this what you want
names default to here(1);
dt = current data table();
colNamesX = dt << get column names(string);
for(i=nitems(colNamesX),i>=1,i--,
	if(contains(colNamesX[i],"Flange")==0,
		remove from(colNamesX,i,1),
		word(4,colNamesX[i],"-.")!="",
			remove from(colNamesX,i,1)
	)
);
colNameColor = column(1)<<get name;

theExpr =
"gb = dt << Graph Builder(
	Size( 534, 464 ),
	Show Control Panel( 0 ),
	Variables(";
for each( {col,index}, colNamesX,
	theExpr = theExpr ||
		"X( :\!"" || col || "\!"n, Position( 1 ) ),";
);
theExpr = theExpr ||
	"Color( :\!"" || colNameColor || "\!"n )
	),
	Elements(
		Box Plot(";
for each( {col,index}, colNamesX,
	theExpr = theExpr ||
		"X( " || char(index) || " ),";
);
theExpr = theExpr ||
	"Legend( 3 )
		),
		Points(";
for each( {col,index}, colNamesX,
	theExpr = theExpr ||
		"X( " || char(index) || " ),";
);
theExpr = theExpr ||
	"Legend( 4 )
		)
	)
);";

// Generate the graph
eval(parse(theExpr));

// Add the USL line
// Find the USL row
theUSLRow = (dt << get rows where(:Phase == "USL"))[1];

// Get the values
USLs = [];
For Each( {col}, colNamesX,
	USLs = USLs || matrix(as column(dt,col)[theUSLRow])
);

// Set the Y axis upper value
report( gb )[AxisBox(2)] << Max(max(USLs)+.1*(max(USLs)-(report( gb )[AxisBox(2)] << get min)));

report( gb )[FrameBox(1)] << Add Graphics Script(
	Pen Color( "red");
	Pen Size( 2 );
	Line Style( "DashDot");

	matX = [];
	For(i=0,i<=length(USLs)-1,i++,
		matX = matX || matrix(i-.5) || matrix( i+.5);
	);
	matY = [];
	For(i=1,i<=length(USLs),i++,
		matY = matY || USLs[i] || USLs[i];
	);
	Line(matX,matY);
	Text Color( "red" );
	textPos = {0};
	insert into(textPos,Max(max(USLs)+.025*(max(USLs)-(report( gb )[AxisBox(2)] << get min))));
	Text( Center Justified, eval(textPos), "USL" );
);
Jim
Recommended Articles
- © 2026 JMP Statistical Discovery LLC. All Rights Reserved.
- Terms of Use
- Privacy Statement
- Contact Us


