- Subscribe to RSS Feed
- Mark Topic as New
- Mark Topic as Read
- Float this Topic for Current User
- Bookmark
- Subscribe
- Mute
- Printer Friendly Page
Discussions
Solve problems, and share tips and tricks with other JMP users.- JMP User Community
- :
- Discussions
- :
- Boosted Tree - Tuning TABLE DESIGN
- Mark as New
- Bookmark
- Subscribe
- Mute
- Subscribe to RSS Feed
- Get Direct Link
- Report Inappropriate Content
Boosted Tree - Tuning TABLE DESIGN
I selected Boosted Tree or a regression problem after it came as the best-performing model in model screening.
May I ask how to use the tuning table design to further optimize the performance of boosted tree?
- Tags:
- windows
Accepted Solutions
- Mark as New
- Bookmark
- Subscribe
- Mute
- Subscribe to RSS Feed
- Get Direct Link
- Report Inappropriate Content
Re: Boosted Tree - Tuning TABLE DESIGN
Hi @AlphaPanda86751,
A tuning table may be helpful indeed if you want to fine-tune hyperparameters of the selected algorithm to improve predictive performances.
May I ask if you already have a validation strategy, in order to prevent overfitting : k-folds cross-validation, validation column, other ... ? Boosted Tree may be more prompt to overfitting than other tree-based methods (like bootstrap forest), so it's always best to have a validation strategy fixed and set before trying to optimize the performances.
In order to use the tuning table design, you can generate a table manually, by setting the hyperparameters factors in columns (Number of Layers, Splits per Tree, Learning Rate, Minimum size split, ...) to test all combinations ("grid-search approach"), or you can also generate a tuning table design with the "Custom Design" platform, by specifying the different hyperparameters factors you want to investigate/fine-tune, the range of values for each, and the model/complexity of the different combinations/interactions you would like to investigate in this hyperparameter space. You can find more infos here (the infos are from Bootstrap Forest platform, but the technique is very similar for Boosted Tree) : Launch the Bootstrap Forest Platform (jmp.com)
Attached you can find an example of a Tuning table generated from the Custom Design platform.
Then you can launch your Boosted Tree platform with the validation strategy you set previously, and let JMP use the Tuning table to test the different hyperparameters values.
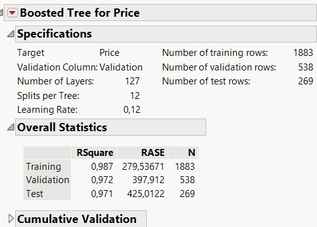
Here is an example of the results with a stratification validation column on the Diamonds Dataset with "normal" (not fine-tuned) Boosted Tree :
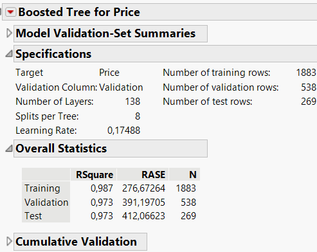
And here is the results by using a Tuning table :
Here there are no big changes between the "default" settings in JMP and the fine-tuned version of Boosted Tree, but it may be helpful and interesting to try the fine-tuning to evaluate the performances changes. You can also evaluate the "robustness" of your hyperparameters fine-tuning if you have used a validation formula column (right-click on Rsquare, RASE or other evaluation metrics, and use "Simulate" to switch in and out the validation column, and set a random seed in order to have reproducible results for the comparison) :
Once again here, it doesn't make a big difference, as the default settings in JMP are good and quite robust, but you can try for yourself.
Attached you'll find the datatable with the Simulations done and the graph script, and you can find the datatable for Diamond Data in the sample Index or also attached here (in order to have the validation column and reproduce the steps presented here).
I hope this will help you,
PS: For inspiration, here are some papers using DoE to fine-tune hyperparameters :
Some publications about optimizations of algorithms with DoE approaches:
"It is not unusual for a well-designed experiment to analyze itself" (Box, Hunter and Hunter)
- Mark as New
- Bookmark
- Subscribe
- Mute
- Subscribe to RSS Feed
- Get Direct Link
- Report Inappropriate Content
Re: Boosted Tree - Tuning TABLE DESIGN
Have you read the documentation about using the tuning table?
- Mark as New
- Bookmark
- Subscribe
- Mute
- Subscribe to RSS Feed
- Get Direct Link
- Report Inappropriate Content
Re: Boosted Tree - Tuning TABLE DESIGN
Hi @AlphaPanda86751,
A tuning table may be helpful indeed if you want to fine-tune hyperparameters of the selected algorithm to improve predictive performances.
May I ask if you already have a validation strategy, in order to prevent overfitting : k-folds cross-validation, validation column, other ... ? Boosted Tree may be more prompt to overfitting than other tree-based methods (like bootstrap forest), so it's always best to have a validation strategy fixed and set before trying to optimize the performances.
In order to use the tuning table design, you can generate a table manually, by setting the hyperparameters factors in columns (Number of Layers, Splits per Tree, Learning Rate, Minimum size split, ...) to test all combinations ("grid-search approach"), or you can also generate a tuning table design with the "Custom Design" platform, by specifying the different hyperparameters factors you want to investigate/fine-tune, the range of values for each, and the model/complexity of the different combinations/interactions you would like to investigate in this hyperparameter space. You can find more infos here (the infos are from Bootstrap Forest platform, but the technique is very similar for Boosted Tree) : Launch the Bootstrap Forest Platform (jmp.com)
Attached you can find an example of a Tuning table generated from the Custom Design platform.
Then you can launch your Boosted Tree platform with the validation strategy you set previously, and let JMP use the Tuning table to test the different hyperparameters values.
Here is an example of the results with a stratification validation column on the Diamonds Dataset with "normal" (not fine-tuned) Boosted Tree :
And here is the results by using a Tuning table :
Here there are no big changes between the "default" settings in JMP and the fine-tuned version of Boosted Tree, but it may be helpful and interesting to try the fine-tuning to evaluate the performances changes. You can also evaluate the "robustness" of your hyperparameters fine-tuning if you have used a validation formula column (right-click on Rsquare, RASE or other evaluation metrics, and use "Simulate" to switch in and out the validation column, and set a random seed in order to have reproducible results for the comparison) :
Once again here, it doesn't make a big difference, as the default settings in JMP are good and quite robust, but you can try for yourself.
Attached you'll find the datatable with the Simulations done and the graph script, and you can find the datatable for Diamond Data in the sample Index or also attached here (in order to have the validation column and reproduce the steps presented here).
I hope this will help you,
PS: For inspiration, here are some papers using DoE to fine-tune hyperparameters :
Some publications about optimizations of algorithms with DoE approaches:
"It is not unusual for a well-designed experiment to analyze itself" (Box, Hunter and Hunter)
Recommended Articles
- © 2026 JMP Statistical Discovery LLC. All Rights Reserved.
- Terms of Use
- Privacy Statement
- Contact Us


