Turn on suggestions
Auto-suggest helps you quickly narrow down your search results by suggesting possible matches as you type.
- JMP Statement Regarding Critical PHP Remote Code Execution Vulnerabilities (CVE-2026-109618, CVE-2026-109619)
- Don’t miss your chance to experience Discovery Summit Europe at our best available rate! Early bird registration through 31 Oct.
- Graph Builder Toolbar streamlines interactive graphing. Creates shortcuts on Report and GraphBuilder Helpers toolbars. Download and install the extension.
Options
- Subscribe to RSS Feed
- Mark Topic as New
- Mark Topic as Read
- Float this Topic for Current User
- Bookmark
- Subscribe
- Mute
- Printer Friendly Page
Discussions
Solve problems, and share tips and tricks with other JMP users.- User Community
- :
- Discussions
- :
- Re: Bivariate Analysis, how to edit graph

Level I
- Mark as New
- Bookmark
- Subscribe
- Mute
- Subscribe to RSS Feed
- Get Direct Link
- Report Inappropriate Content
Bivariate Analysis, how to edit graph
Mar 15, 2024 12:54 AM
(2472 views)
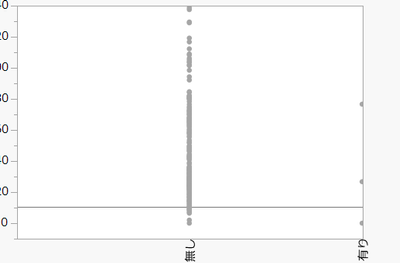
The number of the right dates are smaller than left one.
So, as you can see the points are lining on right side and they are hidden.
Could you tell me how to move the position.
2 REPLIES 2


Super User
- Mark as New
- Bookmark
- Subscribe
- Mute
- Subscribe to RSS Feed
- Get Direct Link
- Report Inappropriate Content
Re: Bivariate Analysis, how to edit graph
Hi @AKARI ,
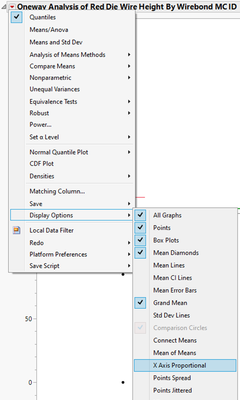
To disable the X-axis proportional, you can click the red triangle -> display options -> untick X-axis proportional
Additional reference can be found here
https://community.jmp.com/t5/Discussions/Oneway-Plot-x-axis-spacing/td-p/193419


Staff
- Mark as New
- Bookmark
- Subscribe
- Mute
- Subscribe to RSS Feed
- Get Direct Link
- Report Inappropriate Content
Re: Bivariate Analysis, how to edit graph
Alternatively, you could just put your cursor on the right-side of the axis when it is the hand tool (or grabber) and drag to the left.
Dan Obermiller
Recommended Articles
- © 2026 JMP Statistical Discovery LLC. All Rights Reserved.
- Terms of Use
- Privacy Statement
- Contact Us