- Subscribe to RSS Feed
- Mark Topic as New
- Mark Topic as Read
- Float this Topic for Current User
- Bookmark
- Subscribe
- Mute
- Printer Friendly Page
Discussions
Solve problems, and share tips and tricks with other JMP users.- JMP User Community
- :
- Discussions
- :
- Generate RSM after DSD in a welding experiment
- Mark as New
- Bookmark
- Subscribe
- Mute
- Subscribe to RSS Feed
- Get Direct Link
- Report Inappropriate Content
Generate RSM after DSD in a welding experiment
Good afternoon!
I made a DSD with 16 factors and 3 responses (responses that must meet different conditions and simultaneously maximum/minimum) in order to screen the main factors and check curvature and quadratic terms in the models.
I would like to know how to generate an RSM and obtain the optimized response for welding, simultaneously meeting the requirements of the responses (the desariblity curves of each response being superimposed and met simultaneously, in this case) without having to generate another DOE (e.g. a Box- Behken). I saw that it is possible to use the "augment design" function in JMP to provide extra runs and it is possible to generate such response surfaces with the DSD itself.
(JMP file is attached)
thank you for your attention!
Accepted Solutions
- Mark as New
- Bookmark
- Subscribe
- Mute
- Subscribe to RSS Feed
- Get Direct Link
- Report Inappropriate Content
Re: Generate RSM after DSD in a welding experiment
Hi @ivanpicchi,
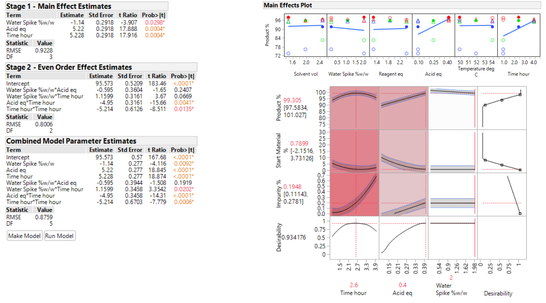
If you have several responses and use "Fit Definitive Screening Design", click on CTRL + "Run Model" to launch the Fit Model platform with all responses. You can fine-tune the models for each response independently if needed.
Then, click on the red triangle next to "Fit Group" and "Profiler" : you'll have a Profiler with all responses and specific model for each response considered.
From there, you can specify the desirability functions (red triangle from Prediction Profiler, "Optimization and Desirability", and "Desirability Functions"), importance of each response, and optimize the levels of the factors to reach the best compromise depending on your settings (red triangle from Prediction Profiler, "Optimization and Desirability", "Maximize Desirability") :
Result :
You can also create your own specific models and try different estimation methods with the "Fit Model" platform, specify all your responses and check the "Fit Separately" option :
From there you will also have access to the "Fit Group" options and the Profiler for all responses to optimize them simultaneously.
I hope this will help you,
"It is not unusual for a well-designed experiment to analyze itself" (Box, Hunter and Hunter)
- Mark as New
- Bookmark
- Subscribe
- Mute
- Subscribe to RSS Feed
- Get Direct Link
- Report Inappropriate Content
Re: Generate RSM after DSD in a welding experiment
You can colorize in red scale the factors on the Profiler based on their importances on the response by clicking on the red triangle of Profiler, then "Assess Variable Importance" and then you can choose to calculate importance depending on the assumption of the factors distributions : https://www.jmp.com/support/help/en/17.2/index.shtml#page/jmp/assess-variable-importance.shtml
Then, on the new panel of the Variable Importance Report, you have the option in the red triangle to "Colorize Profiler", which will apply on the factors in the Profiler the red scale you have seen in my screenshots.
Hope this will help you,
"It is not unusual for a well-designed experiment to analyze itself" (Box, Hunter and Hunter)
- Mark as New
- Bookmark
- Subscribe
- Mute
- Subscribe to RSS Feed
- Get Direct Link
- Report Inappropriate Content
Re: Generate RSM after DSD in a welding experiment
- Would I have to reduce the model to 3 main factors to fit the model and response surfaces?
- How do I change the logworth line to the 0.05 significance level?
- Mark as New
- Bookmark
- Subscribe
- Mute
- Subscribe to RSS Feed
- Get Direct Link
- Report Inappropriate Content
Re: Generate RSM after DSD in a welding experiment
Here (https://prismtc.co.uk/resources/blogs-and-articles/the-evolution-of-definitive-screening-designs-fro...) he screens 6 factors for 3 and apparently generates the model already consider the 3 answers simultaneously.
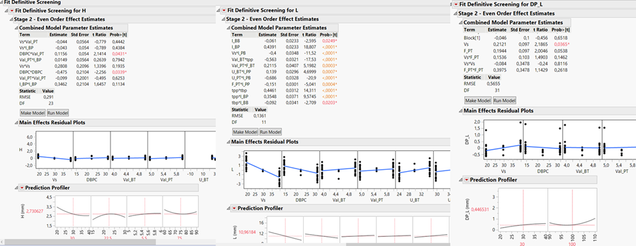
In my file (attached to the post), it generated a separate desirability curve for each response and did the screening independently for each response, even leaving it to generate a model per response, preventing me from achieving the optimized coding while simultaneously obeying the restrictions imposed on each of the 3 responses:
Does anyone have any tips or solutions to resolve this issue? I need to generate a model that meets the restrictions of the 3 answers, simultaneously.
- Mark as New
- Bookmark
- Subscribe
- Mute
- Subscribe to RSS Feed
- Get Direct Link
- Report Inappropriate Content
Re: Generate RSM after DSD in a welding experiment
Hi @ivanpicchi,
If you have several responses and use "Fit Definitive Screening Design", click on CTRL + "Run Model" to launch the Fit Model platform with all responses. You can fine-tune the models for each response independently if needed.
Then, click on the red triangle next to "Fit Group" and "Profiler" : you'll have a Profiler with all responses and specific model for each response considered.
From there, you can specify the desirability functions (red triangle from Prediction Profiler, "Optimization and Desirability", and "Desirability Functions"), importance of each response, and optimize the levels of the factors to reach the best compromise depending on your settings (red triangle from Prediction Profiler, "Optimization and Desirability", "Maximize Desirability") :
Result :
You can also create your own specific models and try different estimation methods with the "Fit Model" platform, specify all your responses and check the "Fit Separately" option :
From there you will also have access to the "Fit Group" options and the Profiler for all responses to optimize them simultaneously.
I hope this will help you,
"It is not unusual for a well-designed experiment to analyze itself" (Box, Hunter and Hunter)
- Mark as New
- Bookmark
- Subscribe
- Mute
- Subscribe to RSS Feed
- Get Direct Link
- Report Inappropriate Content
Re: Generate RSM after DSD in a welding experiment
How did you leave the graphs that have the greatest impact on desirability on the red scale?
- Mark as New
- Bookmark
- Subscribe
- Mute
- Subscribe to RSS Feed
- Get Direct Link
- Report Inappropriate Content
Re: Generate RSM after DSD in a welding experiment
You can colorize in red scale the factors on the Profiler based on their importances on the response by clicking on the red triangle of Profiler, then "Assess Variable Importance" and then you can choose to calculate importance depending on the assumption of the factors distributions : https://www.jmp.com/support/help/en/17.2/index.shtml#page/jmp/assess-variable-importance.shtml
Then, on the new panel of the Variable Importance Report, you have the option in the red triangle to "Colorize Profiler", which will apply on the factors in the Profiler the red scale you have seen in my screenshots.
Hope this will help you,
"It is not unusual for a well-designed experiment to analyze itself" (Box, Hunter and Hunter)
- Mark as New
- Bookmark
- Subscribe
- Mute
- Subscribe to RSS Feed
- Get Direct Link
- Report Inappropriate Content
Re: Generate RSM after DSD in a welding experiment
thanks for sharing
- Mark as New
- Bookmark
- Subscribe
- Mute
- Subscribe to RSS Feed
- Get Direct Link
- Report Inappropriate Content
Re: Generate RSM after DSD in a welding experiment
amazing! ty!
Recommended Articles
- © 2026 JMP Statistical Discovery LLC. All Rights Reserved.
- Terms of Use
- Privacy Statement
- Contact Us


