- Don’t miss your chance to experience Discovery Summit Europe at our best available rate! Early bird registration through 31 Oct.
- Graph Builder Toolbar streamlines interactive graphing. Creates shortcuts on Report and GraphBuilder Helpers toolbars. Download and install the extension.
- JMP will suspend normal business operations for our Rest and Recharge Day on Friday, October 2, 2026.
Regular business hours will resume on Monday, October 5, 2026.
- Subscribe to RSS Feed
- Mark Topic as New
- Mark Topic as Read
- Float this Topic for Current User
- Bookmark
- Subscribe
- Mute
- Printer Friendly Page
Discussions
Solve problems, and share tips and tricks with other JMP users.- User Community
- :
- Discussions
- :
- Bi-plots with error bars for both axis

- Mark as New
- Bookmark
- Subscribe
- Mute
- Subscribe to RSS Feed
- Get Direct Link
- Report Inappropriate Content
Bi-plots with error bars for both axis
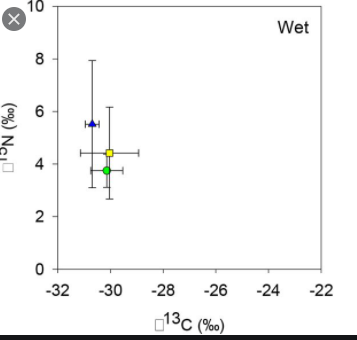
I would like to construct a bi-plot (double plot; two-way distribution), see example below. It would be a central point marking the mean for a given group, with error bars (standard deviation) for both parameters (both axis). I can't find a way to do this easily in jmp, and would appreciate some hints or suggestions. Thanks. Morten, Norway.

- Mark as New
- Bookmark
- Subscribe
- Mute
- Subscribe to RSS Feed
- Get Direct Link
- Report Inappropriate Content
Re: Bi-plots with error bars for both axis
Please find attached a very old add-in (from 2006, actually). It's quite likely that there is a much better way now, but this might suffice.


- Mark as New
- Bookmark
- Subscribe
- Mute
- Subscribe to RSS Feed
- Get Direct Link
- Report Inappropriate Content
Re: Bi-plots with error bars for both axis
Hi @Jartun ,
This can be done in Graph Builder in JMP 15 (or JMP 14).
- Start with a summarize table with these columns: group, mean for x variable, std. dev for x-axis, mean for y variable, std. dev. for y-axis. I used Big Class.jmp and tabulate to make the summarized table and then converted to a JMP Data Table.
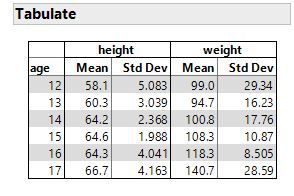
- Drag mean for x to x-axis (height) and mean for y to y-axis (weight)
- Change the Error Interval (called Error Bars in JMP 14) to Two-way Interval
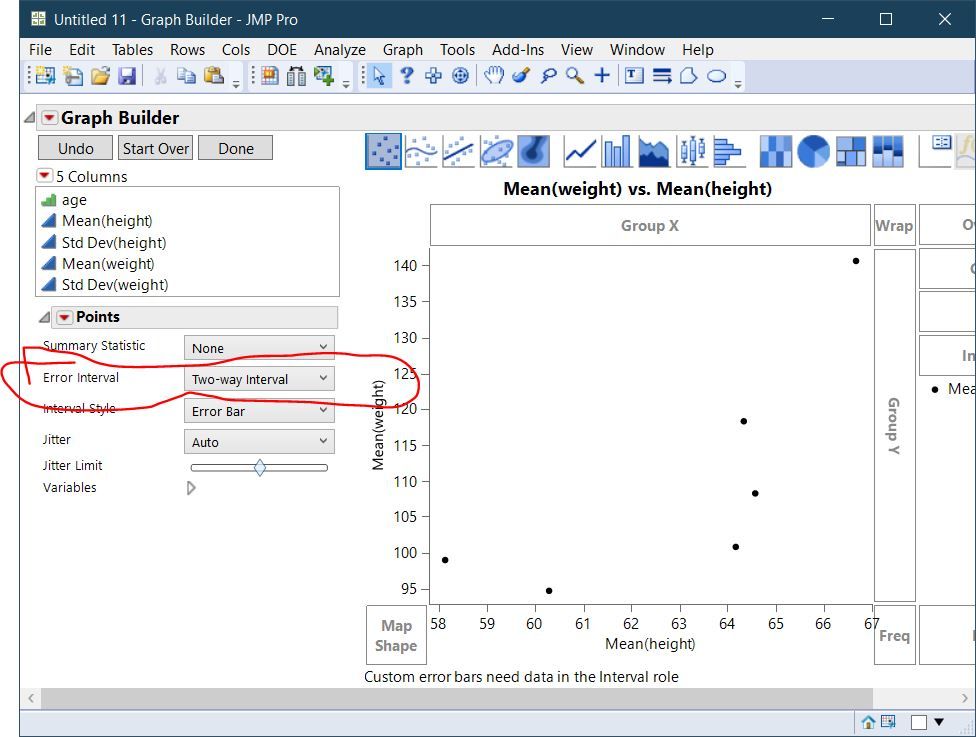
- Drag Std. Dev. for x-axis to interval box/zone on right.
- Drag Std. Dev. for y-axis to same interval box/zone but just to the right of the x-axis std. dev. (see below picture)
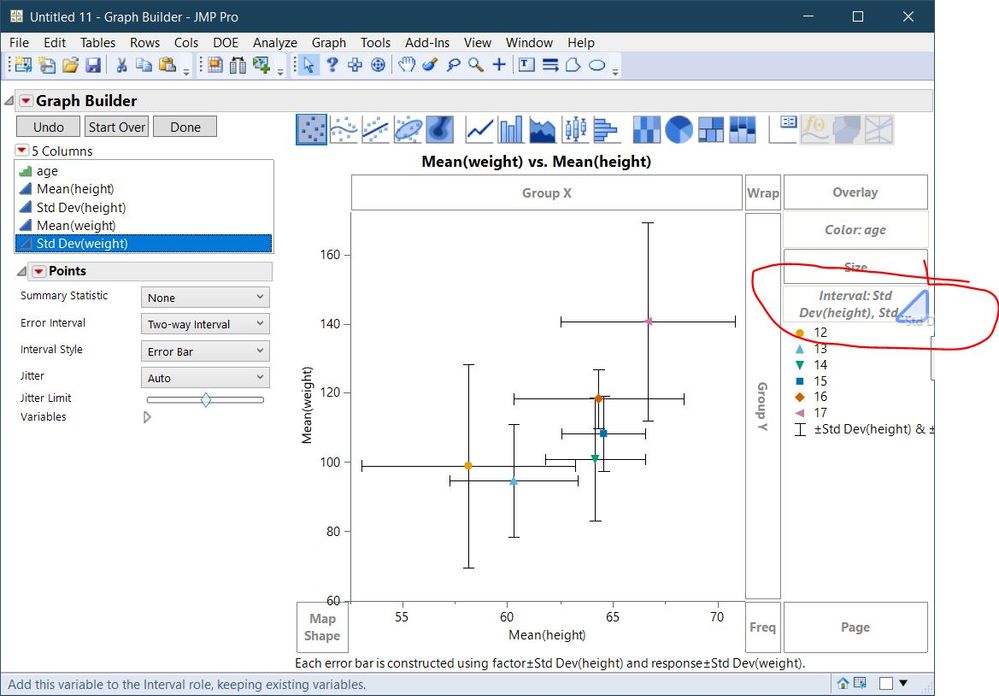
- Add group to Color zone or use Rows>Color or Mark By Column menu function. The final plot looks something like this:
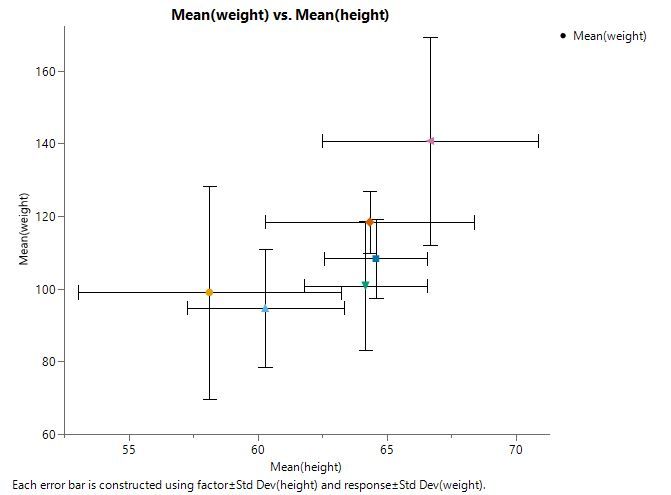
Hope that is what you are looking for.
Best,
Data Scientist, Life Sciences - Global Technical Enablement
JMP Statistical Discovery, LLC. - Denver, CO
Tel: +1-919-531-9927 ▪ Mobile: +1-303-378-7419 ▪ E-mail: [email protected]
www.jmp.com

- Mark as New
- Bookmark
- Subscribe
- Mute
- Subscribe to RSS Feed
- Get Direct Link
- Report Inappropriate Content
Re: Bi-plots with error bars for both axis
I am trying to generate a linear regression line with errors in both X and Y variables. I guess it requires the York fitting. Can you please suggest a way to do this in JMP Pro 16?
Recommended Articles
- © 2026 JMP Statistical Discovery LLC. All Rights Reserved.
- Terms of Use
- Privacy Statement
- Contact Us