Turn on suggestions
Auto-suggest helps you quickly narrow down your search results by suggesting possible matches as you type.
- JMP Statement Regarding Critical PHP Remote Code Execution Vulnerabilities (CVE-2026-109618, CVE-2026-109619)
- Don’t miss your chance to experience Discovery Summit Europe at our best available rate! Early bird registration through 31 Oct.
- Graph Builder Toolbar streamlines interactive graphing. Creates shortcuts on Report and GraphBuilder Helpers toolbars. Download and install the extension.
Options
- Subscribe to RSS Feed
- Mark Topic as New
- Mark Topic as Read
- Float this Topic for Current User
- Bookmark
- Subscribe
- Mute
- Printer Friendly Page
Discussions
Solve problems, and share tips and tricks with other JMP users.- User Community
- :
- Discussions
- :
- Re: Beginner

Level II
- Mark as New
- Bookmark
- Subscribe
- Mute
- Subscribe to RSS Feed
- Get Direct Link
- Report Inappropriate Content
Beginner
Jul 18, 2023 11:54 AM
(1716 views)
Hi,
i want to create an array for two data columns
like
a = [ .........]
b = [......]
i also want to get the mean of both arrays and display in bivariate plot.
i a beginner to jsl and scripting as whole. thank you
1 ACCEPTED SOLUTION
Accepted Solutions


Super User
Solution
- Mark as New
- Bookmark
- Subscribe
- Mute
- Subscribe to RSS Feed
- Get Direct Link
- Report Inappropriate Content
Re: Beginner
Perform the actions interactively in JMP and let JMP script it
- Open JMP
- Create new empty table
- Create your columns interactively
- Use Tabulate/Summary/Distribution/... to calculate means
- Use Fit Y by X to create plot (or graph builder)
- Try out red triangles in different locations to see where you can get and what type of scripts
- If you have JMP16+ check out log (if enhanced log is enabled it has recorded your steps, bivariate plot will be recorded after it is closed)
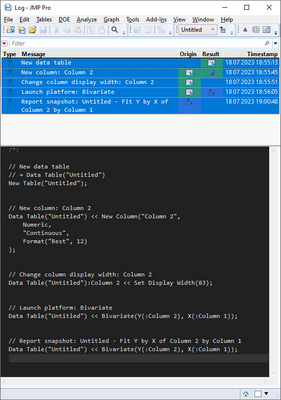
There is a lot of material regarding JMP scripting. Below are few suggestions
- Read Scripting Guide
- Complete Introduction to the JMP Scripting Language
- Check out JSL Cookbook
- Watch JMP Scripters Club learning sessions
-Jarmo
1 REPLY 1
Super User
Solution
- Mark as New
- Bookmark
- Subscribe
- Mute
- Subscribe to RSS Feed
- Get Direct Link
- Report Inappropriate Content
Re: Beginner
Perform the actions interactively in JMP and let JMP script it
- Open JMP
- Create new empty table
- Create your columns interactively
- Use Tabulate/Summary/Distribution/... to calculate means
- Use Fit Y by X to create plot (or graph builder)
- Try out red triangles in different locations to see where you can get and what type of scripts
- If you have JMP16+ check out log (if enhanced log is enabled it has recorded your steps, bivariate plot will be recorded after it is closed)
There is a lot of material regarding JMP scripting. Below are few suggestions
- Read Scripting Guide
- Complete Introduction to the JMP Scripting Language
- Check out JSL Cookbook
- Watch JMP Scripters Club learning sessions
-Jarmo
Recommended Articles
- © 2026 JMP Statistical Discovery LLC. All Rights Reserved.
- Terms of Use
- Privacy Statement
- Contact Us