- New to JMP? Join us Sept. 23-24 for the Early User Edition of Discovery Summit, tailor-made for new users. Register now for free!
- Your voice matters! Tell us how you prefer to receive JMP updates, so we can tailor our communication to your needs. Take short survey.
- See how to access JMP Marketplace - and - find, create & share add-ins to extend your JMP. Watch video.
- Subscribe to RSS Feed
- Mark Topic as New
- Mark Topic as Read
- Float this Topic for Current User
- Bookmark
- Subscribe
- Mute
- Printer Friendly Page
Discussions
Solve problems, and share tips and tricks with other JMP users.- JMP User Community
- :
- Discussions
- :
- Re: Auto Scaling of Variability Chart Y-axis based on USL & LSL spec limit

- Mark as New
- Bookmark
- Subscribe
- Mute
- Subscribe to RSS Feed
- Get Direct Link
- Report Inappropriate Content
Auto Scaling of Variability Chart Y-axis based on USL & LSL spec limit
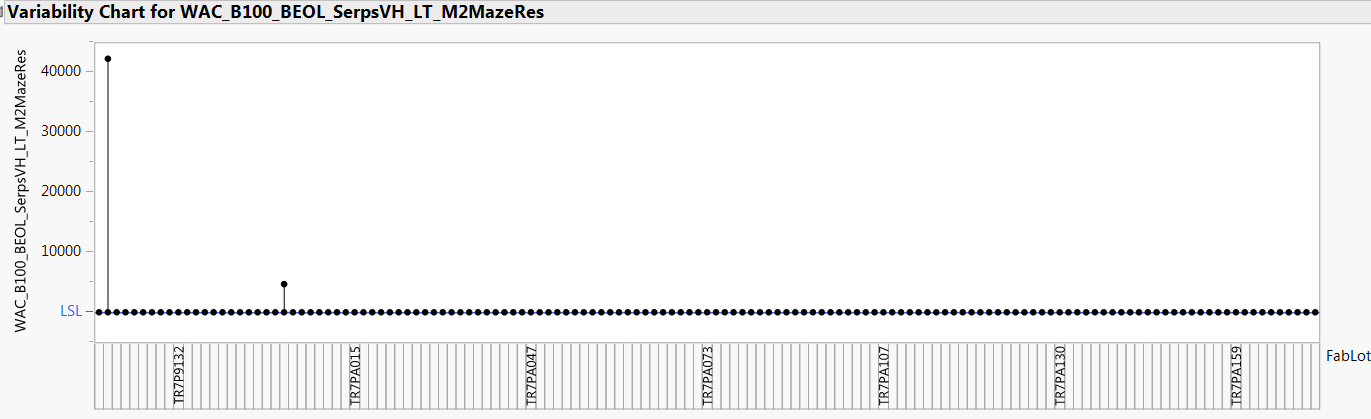
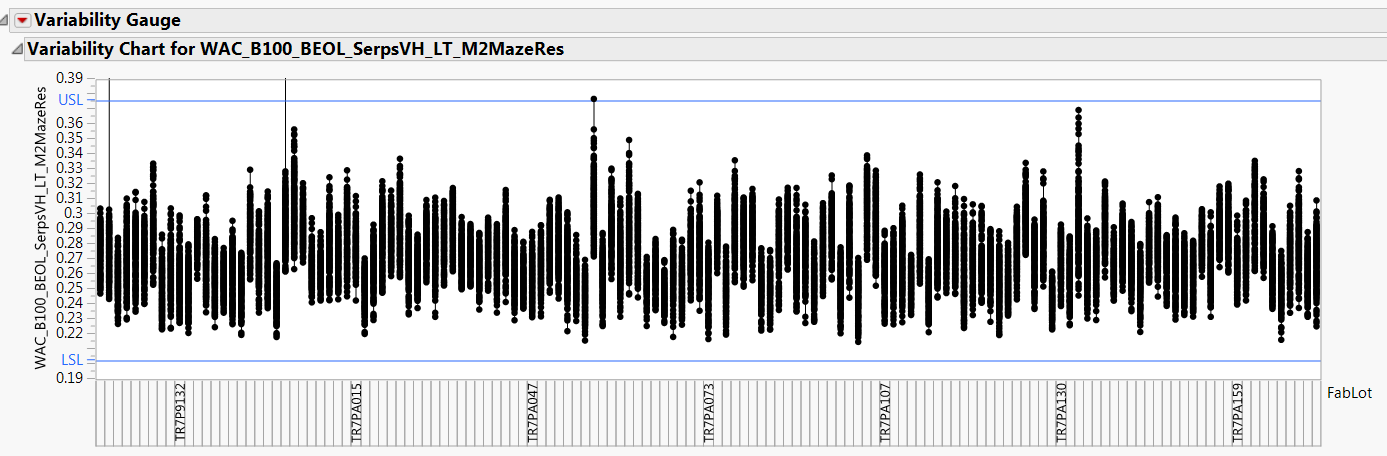
When there is outlier data, my chart is always being scaled to mix or max point, which make the chart not visible.
Is that possible to use JSL script to set the Variability Chart Y-axis dynamically based on the parameters USL & LSL limit that already embeded inside the parameters? Please advice. Thanks
Accepted Solutions

- Mark as New
- Bookmark
- Subscribe
- Mute
- Subscribe to RSS Feed
- Get Direct Link
- Report Inappropriate Content
Re: Auto Scaling of Variability Chart Y-axis based on USL & LSL spec limit
Here is an example script showing the precise code on using the USL and LSL to set the Max and Min axis settings.
Names Default To Here( 1 );
dt = Open( "$SAMPLE_DATA/semiconductor capability.jmp" );

// Turn on Show Limits
spec = dt:NPN1 << Get Property( "Spec Limits" );
	If( Is Empty( spec ) == 0,
		LSL = Try( spec["LSL"], . );
		USL = Try( spec["USL"], . );
		Target = Try( spec["Target"], . );
		Eval(
			Substitute(
					Expr(
						dt:NPN1 <<
						Set Property(
							"Spec Limits",
							{LSL( __LSL__ ), USL( __USL__ ),
							Target( __Target__ ), Show Limits( 1 )}
						),
					),
				Expr( __LSL__ ), LSL,
				Expr( __USL__ ), USL,
				Expr( __Target__ ), Target
			)
		);
	);

// Build the Chart
vc = Variability Chart(
	Y( :NPN1 ),
	X( :lot_id ),
	Max Iter( 100 ),
	Conv Limit( 0.00000001 ),
	Number Integration Abscissas( 128 ),
	Number Function Evals( 65536 ),
	Analysis Type( "Choose best analysis (EMS REML Bayesian)" ),
	Std Dev Chart( 1 )
);

// Set the Min and Max
Report( vc )[axisbox( 1 )] << Max( spec["USL"] );
Report( vc )[axisbox( 1 )] << Min( spec["LSL"] );- Mark as New
- Bookmark
- Subscribe
- Mute
- Subscribe to RSS Feed
- Get Direct Link
- Report Inappropriate Content
Re: Auto Scaling of Variability Chart Y-axis based on USL & LSL spec limit
The simple answer is yes......see
Help==>Scripting Index==>Axis Box
Here is an example from the Scripting Index using Bivariate, but the same functionality is available for the Variability Chart
Names Default To Here( 1 );
Open( "$SAMPLE_DATA/Big Class.jmp" );
biv = Bivariate(
	Y( :weight ),
	X( :height ),
	FitLine
);
rbiv = biv << report;
axisbox = rbiv[axis box( 1 )];
axisbox << Max( 120 );- Mark as New
- Bookmark
- Subscribe
- Mute
- Subscribe to RSS Feed
- Get Direct Link
- Report Inappropriate Content
Re: Auto Scaling of Variability Chart Y-axis based on USL & LSL spec limit
Hi txnelson,
Thanks for advice. But unfortunately it is not the solution that i looking for. The axis box will prompt the user to key in the min / max manually. I want the JSL to take care of scaling automatically according to the params embededed LSL & USL spec without human interaction.
Is there any option to do so?
- Mark as New
- Bookmark
- Subscribe
- Mute
- Subscribe to RSS Feed
- Get Direct Link
- Report Inappropriate Content
Re: Auto Scaling of Variability Chart Y-axis based on USL & LSL spec limit
Here is an example script showing the precise code on using the USL and LSL to set the Max and Min axis settings.
Names Default To Here( 1 );
dt = Open( "$SAMPLE_DATA/semiconductor capability.jmp" );

// Turn on Show Limits
spec = dt:NPN1 << Get Property( "Spec Limits" );
	If( Is Empty( spec ) == 0,
		LSL = Try( spec["LSL"], . );
		USL = Try( spec["USL"], . );
		Target = Try( spec["Target"], . );
		Eval(
			Substitute(
					Expr(
						dt:NPN1 <<
						Set Property(
							"Spec Limits",
							{LSL( __LSL__ ), USL( __USL__ ),
							Target( __Target__ ), Show Limits( 1 )}
						),
					),
				Expr( __LSL__ ), LSL,
				Expr( __USL__ ), USL,
				Expr( __Target__ ), Target
			)
		);
	);

// Build the Chart
vc = Variability Chart(
	Y( :NPN1 ),
	X( :lot_id ),
	Max Iter( 100 ),
	Conv Limit( 0.00000001 ),
	Number Integration Abscissas( 128 ),
	Number Function Evals( 65536 ),
	Analysis Type( "Choose best analysis (EMS REML Bayesian)" ),
	Std Dev Chart( 1 )
);

// Set the Min and Max
Report( vc )[axisbox( 1 )] << Max( spec["USL"] );
Report( vc )[axisbox( 1 )] << Min( spec["LSL"] );- Mark as New
- Bookmark
- Subscribe
- Mute
- Subscribe to RSS Feed
- Get Direct Link
- Report Inappropriate Content
Re: Auto Scaling of Variability Chart Y-axis based on USL & LSL spec limit

- Mark as New
- Bookmark
- Subscribe
- Mute
- Subscribe to RSS Feed
- Get Direct Link
- Report Inappropriate Content
Re: Auto Scaling of Variability Chart Y-axis based on USL & LSL spec limit
Hi,
I want to use the same solution for my trend charts, but I'm having syntax issues.
someone know what fields I need to change if my limits column name are: "CENTERLINE", "LCL_HS", "UCL_HS"?
and also if I need adjustment if I'm creating a Bivariate chart BY columns?
thanks!

- Mark as New
- Bookmark
- Subscribe
- Mute
- Subscribe to RSS Feed
- Get Direct Link
- Report Inappropriate Content
Re: Auto Scaling of Variability Chart Y-axis based on USL & LSL spec limit
Hi,
how to modify this script below to scale the graph automatically to LSL and USL.

Oneway(
	Y(

		:Name( "test1" ),
		:Name( "testn" )

	 ),
	X( :Corner ),
	All Graphs( 0 ),
	Plot Quantile by Actual( 1 ),
	Line of Fit( 0 ),
	Std Dev Lines( 1 ),
	Legend( 0 ),
	SendToReport(
		Dispatch(
			{"Normal Quantile Plot"},
			"Oneway QuantilePlot",
			FrameBox,
			{Row Legend(
				Corner,
				Color( 1 ),
				Color Theme( "" ),
				Marker( 0 ),
				Marker Theme( "" ),
				Continuous Scale( 0 ),
				Reverse Scale( 0 ),
				Excluded Rows( 0 )
			)}
		)
	)
)- Mark as New
- Bookmark
- Subscribe
- Mute
- Subscribe to RSS Feed
- Get Direct Link
- Report Inappropriate Content
Re: Auto Scaling of Variability Chart Y-axis based on USL & LSL spec limit
Here is a script that should show you how to get the axes correctly specified. The new learning you will need to study is the manipulation of Display Trees. This is documented in the Scripting Guide found in the JMP Documentation Library
Help==>JMP Documentation Library

Names Default To Here( 1 );
dt = Open( "$SAMPLE_DATA/semiconductor capability.jmp" );

colList = {"NPN1","PNP1"};

For(i=1,i<=N Items(colList),i++,
// Turn on Show Limits
spec = column(dt,colList[i]) << Get Property( "Spec Limits" );
	If( Is Empty( spec ) == 0,
		LSL = Try( spec["LSL"], . );
		USL = Try( spec["USL"], . );
		Target = Try( spec["Target"], . );
		Eval(
			Substitute(
					Expr(
						column(dt, colList[i]) <<
						Set Property(
							"Spec Limits",
							{LSL( __LSL__ ), USL( __USL__ ),
							Target( __Target__ ), Show Limits( 1 )}
						),
					),
				Expr( __LSL__ ), LSL,
				Expr( __USL__ ), USL,
				Expr( __Target__ ), Target
			)
		);
	);
);

// create the graphs
ow = Oneway(
	Y(

		:Name( "NPN1" ),
		:Name( "PNP1" )

	 ),
	X( :site ),
	All Graphs( 0 ),
	Plot Quantile by Actual( 1 ),
	Line of Fit( 0 ),
	Std Dev Lines( 1 ),
	Legend( 0 ),
	SendToReport(
		Dispatch(
			{"Normal Quantile Plot"},
			"Oneway QuantilePlot",
			FrameBox,
			{Row Legend(
				Corner,
				Color( 1 ),
				Color Theme( "" ),
				Marker( 0 ),
				Marker Theme( "" ),
				Continuous Scale( 0 ),
				Reverse Scale( 0 ),
				Excluded Rows( 0 )
			)}
		)
	)
);

owr = ow << report;

// adjust the axes
For( i=1, i<= n items(owr),i++,
	spec = column(dt,colList[i]) << Get Property( "Spec Limits" );
	(owr[i])[AxisBox(2)] << min(spec["LSL"])<<max(spec["USL"])
);
- Mark as New
- Bookmark
- Subscribe
- Mute
- Subscribe to RSS Feed
- Get Direct Link
- Report Inappropriate Content
Re: Auto Scaling of Variability Chart Y-axis based on USL & LSL spec limit
Thanks! It worked.
1)
Could you also please help me to adjust the x axis settings with the help of a script?
There is no values between LSL and USL.
Perhaps, there is a strategy to adjust the x axis with meaningful Tick/ Bin Increment automatically?
2)
Is it possible to give colList = {"NPN1","PNP1"}; to
ow = Oneway(
Y(
:Name( "NPN1" ),
:Name( "PNP1" )
), --> instead of :Name(), :Name()

- Mark as New
- Bookmark
- Subscribe
- Mute
- Subscribe to RSS Feed
- Get Direct Link
- Report Inappropriate Content
Re: Auto Scaling of Variability Chart Y-axis based on USL & LSL spec limit
Please see the script below for the changes required to handle your new requests. In most cases, any list of columns will be able to be substituted into a Platform request, with an Eval() function, which expresses the list to JMP. See the
Eval( colList )in the script below.
Assuming you have now read the section on Display Trees in the Scripting Guide, the messages that can be passed to the Display Objects are documented with examples in the Scripting Index
Help==>Scripting Index
Examining the Messages for AxisBox(), you will see all of the messages available. Among which is Inc(). It is this changing of the increment of the axis that is being used to insure values in the graph after changing the min and max axis values.
Names Default To Here( 1 );
dt = Open( "$SAMPLE_DATA/semiconductor capability.jmp" );

colList = {"NPN1", "PNP1"};

For( i = 1, i <= N Items( colList ), i++,
// Turn on Show Limits
	spec = Column( dt, colList[i] ) << Get Property( "Spec Limits" );
	If( Is Empty( spec ) == 0,
		LSL = Try( spec["LSL"], . );
		USL = Try( spec["USL"], . );
		Target = Try( spec["Target"], . );
		Eval(
			Substitute(
					Expr(
						Column( dt, colList[i] ) << Set Property(
							"Spec Limits",
							{LSL( __LSL__ ), USL( __USL__ ), Target( __Target__ ), Show Limits( 1 )}
						),

					),
				Expr( __LSL__ ), LSL,
				Expr( __USL__ ), USL,
				Expr( __Target__ ), Target
			)
		);
	);
);

// create the graphs
ow = Oneway(
	Y(

		eval(colList)

	),
	X( :site ),
	All Graphs( 0 ),
	Plot Quantile by Actual( 1 ),
	Line of Fit( 0 ),
	Std Dev Lines( 1 ),
	Legend( 0 ),
	SendToReport(
		Dispatch(
			{"Normal Quantile Plot"},
			"Oneway QuantilePlot",
			FrameBox,
			{Row Legend(
				Corner,
				Color( 1 ),
				Color Theme( "" ),
				Marker( 0 ),
				Marker Theme( "" ),
				Continuous Scale( 0 ),
				Reverse Scale( 0 ),
				Excluded Rows( 0 )
			)}
		)
	)
);

owr = ow << report;

// adjust the axes
For( i = 1, i <= N Items( owr ), i++,
	spec = Column( dt, colList[i] ) << Get Property( "Spec Limits" );
	(owr[i])[AxisBox( 2 )] << Min( spec["LSL"] ) << Max( spec["USL"] )
		<< inc ((spec["USL"] - spec["LSL"]) / 10 );
);Recommended Articles
- © 2026 JMP Statistical Discovery LLC. All Rights Reserved.
- Terms of Use
- Privacy Statement
- Contact Us