- Instantly extract effect sizes, F-ratios, and FDR-adjusted p-values from your models with the Calculate Effects Sizes extension, available now in the JMP Marketplace!
- New to JMP? Join us Sept. 23-24 for the Early User Edition of Discovery Summit, tailor-made for new users. Register now for free!
- See how to use the JMP Marketplace – Free tools to expand JMP capabilities. Register. July 10, 2 pm US Eastern Time.
- Subscribe to RSS Feed
- Mark Topic as New
- Mark Topic as Read
- Float this Topic for Current User
- Bookmark
- Subscribe
- Mute
- Printer Friendly Page
Discussions
Solve problems, and share tips and tricks with other JMP users.- JMP User Community
- :
- Discussions
- :
- Re: Analysis of stress-strain curve data

- Mark as New
- Bookmark
- Subscribe
- Mute
- Subscribe to RSS Feed
- Get Direct Link
- Report Inappropriate Content
Analysis of stress-strain curve data
Hi
I'm completely new to JMP and have recently signed up for the trial license, with the purpose of investigating if JMP can provide any value with regards to analysis of data from uni-axial tensile testing of materials. I've attached a sample set of data, which represents the stress and strain output from the testing.
The data should be viewed as a time history data and I'm hopping that I can get some input on how to most efficiently apply JMP, and what tools I could use. I'm interested in determining sings such as the following:
- The yield stress and strain with confidence. The yield point is the first point where the slope is zero.
- Fit a curve and consider some sort of metric to quantify if the data can be assessed with confidence to represent the population.
Any input will be highly appropriated.
Accepted Solutions

- Mark as New
- Bookmark
- Subscribe
- Mute
- Subscribe to RSS Feed
- Get Direct Link
- Report Inappropriate Content
Re: Analysis of stress-strain curve data
All of these suggestions are terrific. But if you are like most of us, you want to know the benefit before investing the time. I extended @statman's suggestions and @P_Bartell using basic features of JMP.
Data Prep
- The Excel table you provided had circular links for both labels and values. In Excel, I did a quick copy/paste of your tables, specifying values and saved it. I don't know of a method in JMP's Excel Wizard to say use Values, however from Excel you can make a JMP table if you have the JMP add-in,
- In JMP, I used the Excel Wizard to read in the data, using the first 3 columns as headers and data starts on line 4.
- Excel graphs need multiple series x-y to plot multiple or overlay pictures. Most JMP platforms use tables organized like database tables with identifiers, other columns to select, filter or key off of.
- From the JMP main menu you can easily convert the Excel type format to a database format with Main Menu > Tables > Stack. The dialog is shown below. By specifying all the Test columns, a Multiple Series Stack, 2 series, and contiguous the resulting table is almots ready for JMP graphs and analyses.
- Change the two data columns names/titles and specified units. See the bullets below. Then create a new columns for the Test ID


Data Graph and Analyses
- Once the steps above are completed. Main Menu > Graphs > Graph Builder. This has a drag and drop interface.
- Click on stress and drag to the Y column area.
- Click on Strain and drag to the X column area
- Click on Test ID and drag to the Wrap area and to the color area
- Now another nice fetauer is interactive filtering. From the Graph Builder red triange select Add Data Filter. I suggest Strain and Test ID. The picture is below. Now you can select on some tests, darg tke blue line or click and change the min and max values for Strain.
This will show how easy it is to work with JMP graphs and the nice UIs. For modeling, the yes @Mark_Bailey is correct JMP PRO is terrific. I don't recall if non-linear modeling is available in basic JMP.
Finally, you can capture most of the steps to a JMP script, which is important if you need to do this for new data, periodically.
Good luck.


- Mark as New
- Bookmark
- Subscribe
- Mute
- Subscribe to RSS Feed
- Get Direct Link
- Report Inappropriate Content
Re: Analysis of stress-strain curve data
You can proceed this way but JMP Pro offers a feature called the Functional Data Explorer. Instead of thinking about (x,y) points as observations, the entire curve is an observation. The curves are fit to basis function expansion models from which functional principal components are extracted. These FPCs can then be used as X or Y data in further analysis. For example, you could design an experiment to determine which factors affect the curve shape. You can model the effect of the factors.

- Mark as New
- Bookmark
- Subscribe
- Mute
- Subscribe to RSS Feed
- Get Direct Link
- Report Inappropriate Content
Re: Analysis of stress-strain curve data

- Mark as New
- Bookmark
- Subscribe
- Mute
- Subscribe to RSS Feed
- Get Direct Link
- Report Inappropriate Content
Re: Analysis of stress-strain curve data
I agree with everything @Mark_Bailey and @andersonmj2 recommend...but my guess is your trial version of JMP isn't JMP Pro. So lacking JMP Pro, you'll not be able to use, exclusive to JMP Pro, Functional Data Explorer capabilities. But all is not lost...there are several analytics pathways in JMP that can help. Since you are completely new to JMP...I recommend spending 60 minutes watching the On Demand "Getting Started with JMP" webinar. This will give you a feel for how to get your data from Excel into JMP, show you some of the plethora of JMP data visualization capabilities, and some thoughts around sharing your discoveries with others. Here's a link to the webinar:
https://www.jmp.com/en_us/events/ondemand/non-series/getting-started-with-jmp.html

- Mark as New
- Bookmark
- Subscribe
- Mute
- Subscribe to RSS Feed
- Get Direct Link
- Report Inappropriate Content
Re: Analysis of stress-strain curve data
Forrest,
Welcome to the JMP community. JMP is extremely capable of providing assistance in the analysis of data. It will be possible to answer many questions to provide confidence in the interpretation of data. While JMP is superior at data analysis, it will take subject matter experts to interpret the outputs. Some of the questions you ask are not a function of the data analysis tool. Whether your data set "represents the population" is a function of how representative your sampling plan is (how was the data acquired).
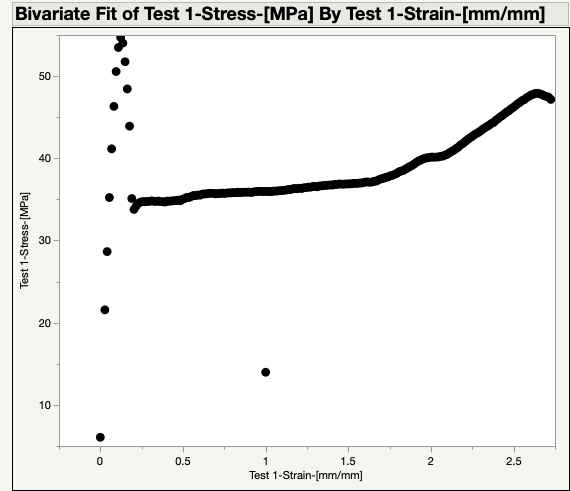
I've taken a look at your data set, but without understanding context and how the data was taken, analysis is a bit of a guess. Apparently you have some material that you apply a force to (e.g, tensile) and you then measure the cross sectional area and elongation (stress and strain). What you can do with JMP is a function of what is captured in the data set. With the provided data set, JMP can easily plot the stress/strain curves (attached) and fit all kinds of curves to the plots (regardless of whether they are meaningful or not). I have found JMP to be very helpful in visualizing relationships between variables (predictor and response). It will help answer your engineering and scientific questions, but I recommend you have some training before just randomly "clicking buttons". In addition to this forum, there are a number of resources available to learn to use the software (on-line tutorials, new user welcome kit, etc.)
- Mark as New
- Bookmark
- Subscribe
- Mute
- Subscribe to RSS Feed
- Get Direct Link
- Report Inappropriate Content
Re: Analysis of stress-strain curve data
All of these suggestions are terrific. But if you are like most of us, you want to know the benefit before investing the time. I extended @statman's suggestions and @P_Bartell using basic features of JMP.
Data Prep
- The Excel table you provided had circular links for both labels and values. In Excel, I did a quick copy/paste of your tables, specifying values and saved it. I don't know of a method in JMP's Excel Wizard to say use Values, however from Excel you can make a JMP table if you have the JMP add-in,
- In JMP, I used the Excel Wizard to read in the data, using the first 3 columns as headers and data starts on line 4.
- Excel graphs need multiple series x-y to plot multiple or overlay pictures. Most JMP platforms use tables organized like database tables with identifiers, other columns to select, filter or key off of.
- From the JMP main menu you can easily convert the Excel type format to a database format with Main Menu > Tables > Stack. The dialog is shown below. By specifying all the Test columns, a Multiple Series Stack, 2 series, and contiguous the resulting table is almots ready for JMP graphs and analyses.
- Change the two data columns names/titles and specified units. See the bullets below. Then create a new columns for the Test ID
Data Graph and Analyses
- Once the steps above are completed. Main Menu > Graphs > Graph Builder. This has a drag and drop interface.
- Click on stress and drag to the Y column area.
- Click on Strain and drag to the X column area
- Click on Test ID and drag to the Wrap area and to the color area
- Now another nice fetauer is interactive filtering. From the Graph Builder red triange select Add Data Filter. I suggest Strain and Test ID. The picture is below. Now you can select on some tests, darg tke blue line or click and change the min and max values for Strain.
This will show how easy it is to work with JMP graphs and the nice UIs. For modeling, the yes @Mark_Bailey is correct JMP PRO is terrific. I don't recall if non-linear modeling is available in basic JMP.
Finally, you can capture most of the steps to a JMP script, which is important if you need to do this for new data, periodically.
Good luck.
- Mark as New
- Bookmark
- Subscribe
- Mute
- Subscribe to RSS Feed
- Get Direct Link
- Report Inappropriate Content
Re: Analysis of stress-strain curve data
Just in case you want to play with your data in JMP, I created a script to clean up and read your Excel and create the Graph Builder plot.
I do not have the trial version of JMP so I cannot test if this will work for you.
Note I downloaded your Sample Data.xlsx to c:\temp. It will be easier if you do the same to test the script without editing.
- Open the script in JMP
- Select the the Green Go triangle (has a document behind it) from the main menu. If it works you will see the graphbuilder plot shown in the previous post.
- Mark as New
- Bookmark
- Subscribe
- Mute
- Subscribe to RSS Feed
- Get Direct Link
- Report Inappropriate Content
Re: Analysis of stress-strain curve data
Thanks to everybody for their time and interest. I currently do not have access to JMP Pro, but with the good advise here I'll continue to explore my data.
Recommended Articles
- © 2026 JMP Statistical Discovery LLC. All Rights Reserved.
- Terms of Use
- Privacy Statement
- Contact Us