- Don’t miss your chance to experience Discovery Summit Europe at our best available rate! Early bird registration through 31 Oct.
- Graph Builder Toolbar streamlines interactive graphing. Creates shortcuts on Report and GraphBuilder Helpers toolbars. Download and install the extension.
- Subscribe to RSS Feed
- Mark Topic as New
- Mark Topic as Read
- Float this Topic for Current User
- Bookmark
- Subscribe
- Mute
- Printer Friendly Page
Discussions
Solve problems, and share tips and tricks with other JMP users.- User Community
- :
- Discussions
- :
- Adjusting spacing between figure categories

- Mark as New
- Bookmark
- Subscribe
- Mute
- Subscribe to RSS Feed
- Get Direct Link
- Report Inappropriate Content
Adjusting spacing between figure categories
Is there a way to adjust the spacing between categories within figures. I frequently make bar graphs and dot plots with multiple categories and am unable to distinguish different groups. In this example I am plotting mass against SAID (Sample IDs) and number of cycles. I would like to separate the SAIDs to help visualize the samples separately. Is there a way to do this without changing the width of the bars or the spacing between cycles? Thanks for your help.


- Mark as New
- Bookmark
- Subscribe
- Mute
- Subscribe to RSS Feed
- Get Direct Link
- Report Inappropriate Content
Re: Adjusting spacing between figure categories
I suggest that you use your SAID column as an X Grouping variable and your PCR Cycles as the X axis variable.

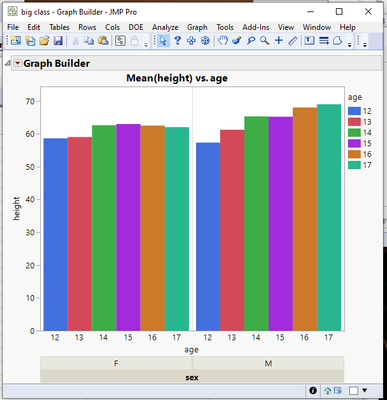
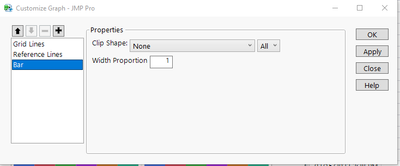
You can then right click on the graph and select "Customize" and change the Bar's Width Proportion to whatever you need it to be, for each of the levels of the X Grouping

- Mark as New
- Bookmark
- Subscribe
- Mute
- Subscribe to RSS Feed
- Get Direct Link
- Report Inappropriate Content
Re: Adjusting spacing between figure categories
In addition to @txnelsons answer if you are going to use the variables as grouping variables, it allows you to set Graph Spacing. This will set wider "bar" between different groups

Recommended Articles
- © 2026 JMP Statistical Discovery LLC. All Rights Reserved.
- Terms of Use
- Privacy Statement
- Contact Us