- Don’t miss your chance to experience Discovery Summit Europe at our best available rate! Early bird registration through 31 Oct.
- Graph Builder Toolbar streamlines interactive graphing. Creates shortcuts on Report and GraphBuilder Helpers toolbars. Download and install the extension.
- Subscribe to RSS Feed
- Mark Topic as New
- Mark Topic as Read
- Float this Topic for Current User
- Bookmark
- Subscribe
- Mute
- Printer Friendly Page
Discussions
Solve problems, and share tips and tricks with other JMP users.- User Community
- :
- Discussions
- :
- A question related to generating a plot using JMP

- Mark as New
- Bookmark
- Subscribe
- Mute
- Subscribe to RSS Feed
- Get Direct Link
- Report Inappropriate Content
A question related to generating a plot using JMP
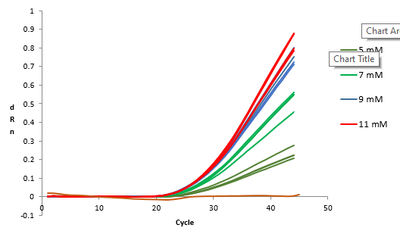
Wonder if anyone know how to plot using JMP to get a plot similar to what I generated using excel.
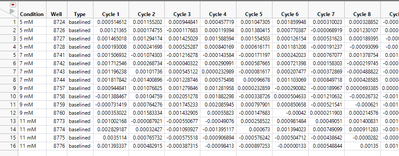
The JMP table is attached.
Accepted Solutions


- Mark as New
- Bookmark
- Subscribe
- Mute
- Subscribe to RSS Feed
- Get Direct Link
- Report Inappropriate Content
Re: A question related to generating a plot using JMP
When working with JMP, you need to think in terms of variables. Your plot shows a variable called Cycle on the X-axis. It has a variable called dRn on the y-axis. So, I will need those two columns. I also see different wells and conditions, so those will be other variables that should be in the table. Each variable gets a column.
To get the data into the right format, I stacked all of your Cycle columns into a single column which I just called Cycle. I then stripped off only the number from that character string to create a column called Cycle Number. From your picture, it also looks like you wanted different lines for each Well and Condition combination. So, I created that column. The resulting data table is attached.
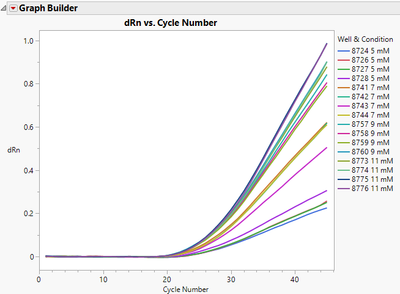
The graph is made from Graph Builder. Drag Cycle Number to the X-axis, dRn to the y-axis, and the Well&Condition column to the overlay.

- Mark as New
- Bookmark
- Subscribe
- Mute
- Subscribe to RSS Feed
- Get Direct Link
- Report Inappropriate Content
Re: A question related to generating a plot using JMP
The trick is to stack all the Cycle columns. Attached is the result with the graph stored as a script (top left).
- Mark as New
- Bookmark
- Subscribe
- Mute
- Subscribe to RSS Feed
- Get Direct Link
- Report Inappropriate Content
Re: A question related to generating a plot using JMP
When working with JMP, you need to think in terms of variables. Your plot shows a variable called Cycle on the X-axis. It has a variable called dRn on the y-axis. So, I will need those two columns. I also see different wells and conditions, so those will be other variables that should be in the table. Each variable gets a column.
To get the data into the right format, I stacked all of your Cycle columns into a single column which I just called Cycle. I then stripped off only the number from that character string to create a column called Cycle Number. From your picture, it also looks like you wanted different lines for each Well and Condition combination. So, I created that column. The resulting data table is attached.
The graph is made from Graph Builder. Drag Cycle Number to the X-axis, dRn to the y-axis, and the Well&Condition column to the overlay.
- Mark as New
- Bookmark
- Subscribe
- Mute
- Subscribe to RSS Feed
- Get Direct Link
- Report Inappropriate Content
Re: A question related to generating a plot using JMP
Thank you very much for the solution.
Recommended Articles
- © 2026 JMP Statistical Discovery LLC. All Rights Reserved.
- Terms of Use
- Privacy Statement
- Contact Us