- We’re retiring the File Exchange at the end of this year. The JMP Marketplace is now your destination for add-ins and extensions.
- JMP 19 is here! Learn more about the new features.
Scott Wise's Blog
- JMP User Community
- :
- Blogs
- :
- Scott Wise
- :
- Are Major League Baseball No-No Totals Go-Go for Record Levels? (Using Visual Tr...
- Subscribe to RSS Feed
- Mark as New
- Mark as Read
- Bookmark
- Subscribe
- Printer Friendly Page
- Report Inappropriate Content

Editor’s Note: This monthly blog from Scott Wise, JMP Principal Engineer, seeks to find interesting uses of statistical discovery to solve deep questions dealing with business/economics, sports, history and psychology. This month’s entry looks at solving the debate on whether baseball no-hitters by year are increasing in number. Thanks to JMP Baseball Expert Lou Valente for his help with this subject!
On a recent trip late this summer, I was able to take in a Seattle Mariners baseball game on a lovely night in the Pacific Northwest. Unfortunately, the Mariners went down in defeat at the hands of the Orioles that night. However, the very next day, Mariner’s pitcher Hisashi Iwakuma went on to throw the fourth no-hitter of this year!
For any non-baseball aficionados, a “no-hitter” (or “no-no”) is a rare baseball game where the pitcher does not allow any hits to the other team over the course of the entire game. There have already been six no-hitters thrown this season, putting us within one of the all time record of seven in a season (last seen in 1990, 1991 and 2012). While historically we average only two no-hitters per season, we are seeing totals well above the average since 2010! So a hot debate has started up in trying to explain this rash of no-hitters in modern day baseball.
My interest was further peaked when the New York times posted an article by Benjamin Hoffman on Sept 5th titled “Spurt of no-hitters may not be all that exceptional.” In the article the author argues that the number of no-hitters is still randomly varying around an average of 2.65 no hitters per season. So in any given season we are just as likely to see zero no-hitters as we are to see a season with seven no-hitters. http://www.nytimes.com/2015/09/06/sports/baseball/a-spurt-of-no-hitters-may-not-be-all-that-exceptio...
However, another article by Mike Oz of Yahoo Sports on Aug 31st titled “The Decade of the No-No: We're seeing the most MLB no-hitters since the '60s” makes quite the opposite claim that we are in a period of increasing no-hitters that is fundamentally different than seasons in previous decades. http://sports.yahoo.com/blogs/mlb-big-league-stew/no-hitters-mlb-decade-180135270.html
So this begs the question, which argument is right? Are no-hitters increasing in baseball today or is it just expected variation from season to season? Never on to shy away from a statistical sports challenge, I enlisted the help of JMP’s resident baseball guru Lou Valente. Lou noted that we should really be looking at seasonal no-hitter trends and patterns over time. So we began by downloading no-hitter performance by year from ESPN. http://espn.go.com/mlb/history/nohitters
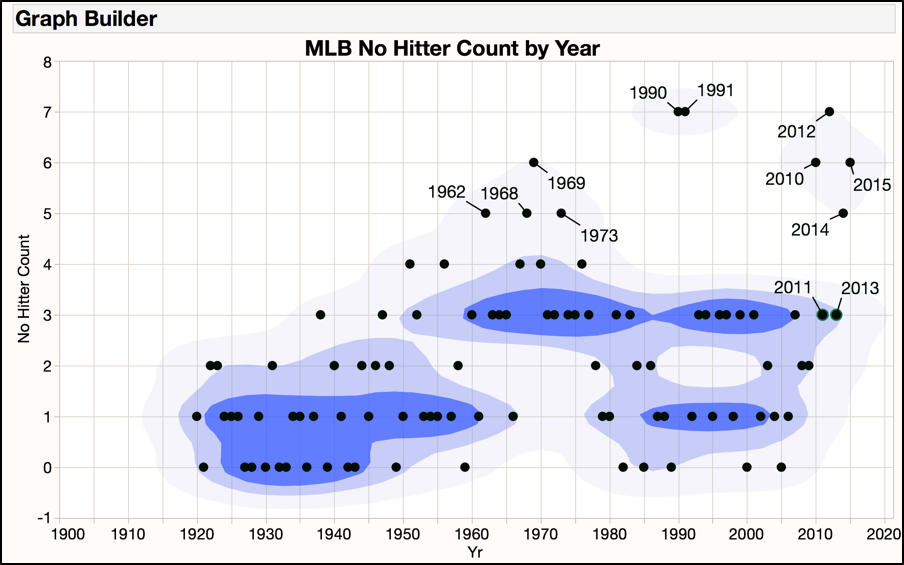
First we looked just the pattern of no-hitter counts by year on a scatter plot graph shaded by density. As the NY Times article pointed out, there have been other years where a high number of five or more no-hitters were thrown, mainly in the 1960’s and the early 1990’s. But visually we can see that the 2010 decade is worth more investigation as no fewer than three no-hitters have been thrown so far for six straight years!
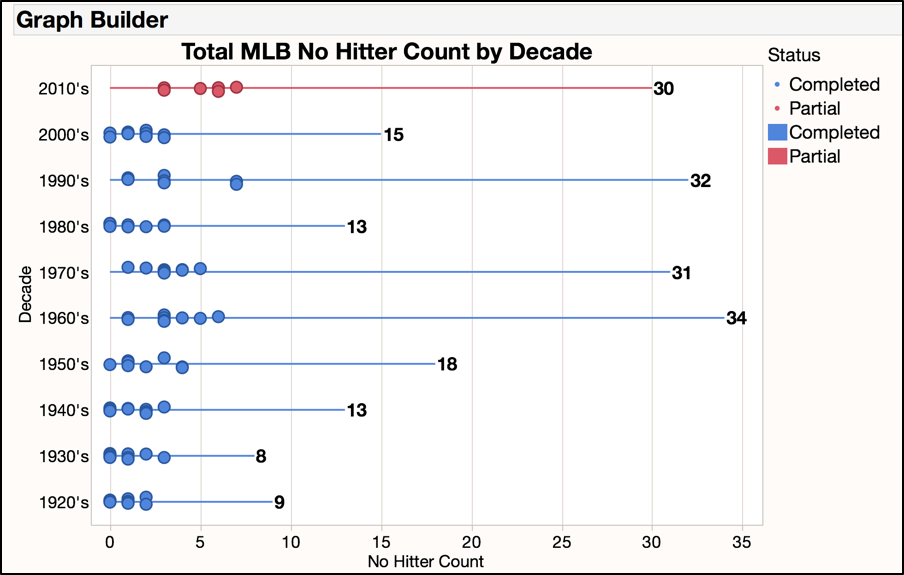
We next graphed total no-hitters count by decade. It is plain to see that even with four more years to go to finish the 2010 decade, the first six years have yielded a whopping 30 total no-hitters so far. If we even only see closer to a historic average over the next four years of two to three no-hitters thrown, we would still be on track to see the highest total no-hitter decade ever (of 38 to 42 total no-hitters)! So this seems to yield some credence to the Yahoo Sports claim of increasing no-hitters in modern baseball today!
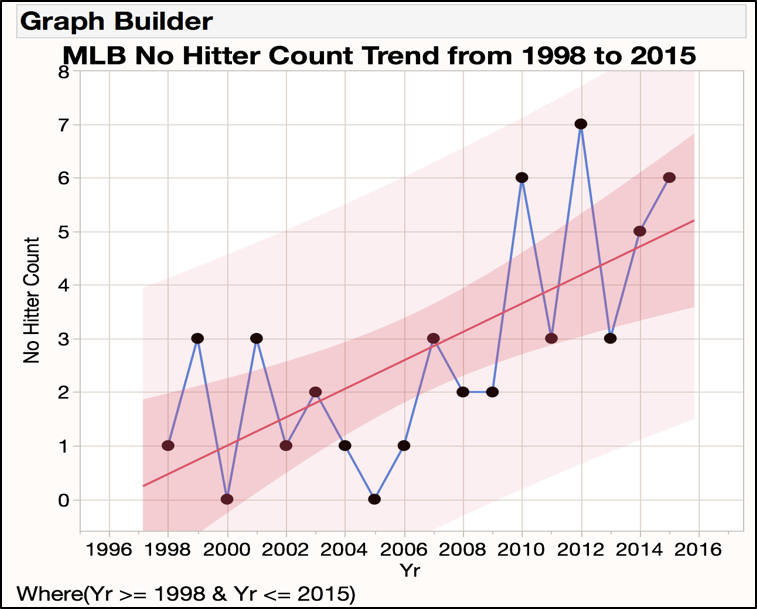
However, baseball has changed significantly over the past one hundred years with changes often made to increase the excitement of seeing more offense (hits, homers and runs) that would make it harder to throw no-hitters. For example, right at the end of the 1960’s the pitchers mound was actually lowered in an effort to increase offense and reduce the strong advantage that pitching seemed to hold in this decade. But sometimes changes can help to increase the chance of seeing no-hitters, such as the league expansion in the 1990’s that added four new teams and therefore more games and chances for no-hitters in the regular season! So the fair comparison might be to focus in on the more recent time frame when the rules and number of teams/games were roughly the same. So starting in 1998 we looked at the overall no-hitter count trend through the season so far in 2015.
By fitting a trend chart over time, you can easily see that there does seem to be an overall trend showing an increasing number of no-hitters in baseball. You can also see a fitted line drawn through the chart with fit and prediction confidence interval shadings that gives us a little more visual evidence of the upward trend in no-hitters. While there is still a lot of variation in no-hitters from year to year, the trend still looks to be holding firm.
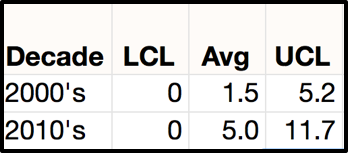
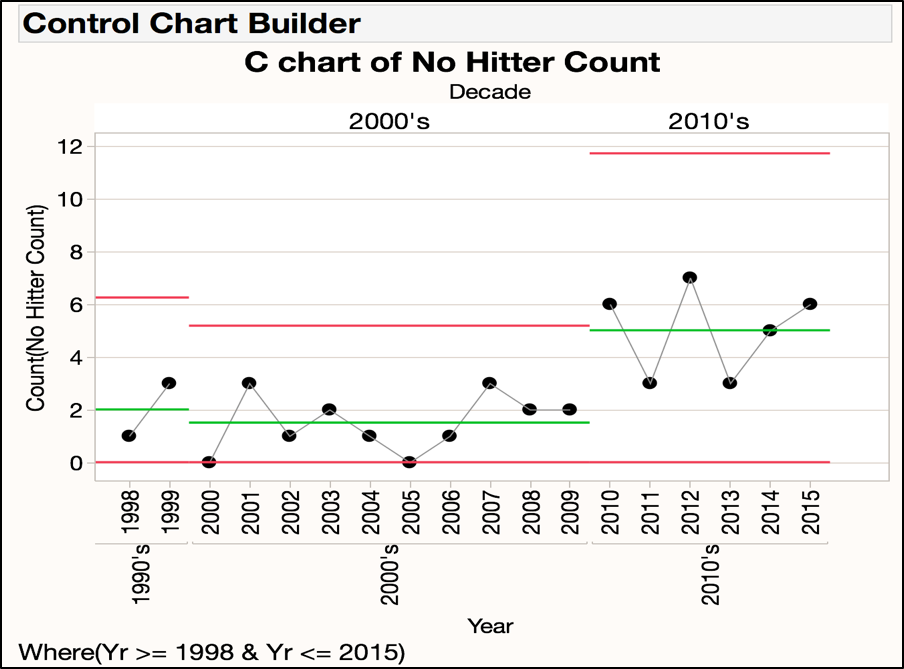
To take this a step further, we applied Control Charts by decade (in this case an attribute C chart for counts) to get another perspective. Control Charts have been described as “run/trend charts on steroids” and basically adds control limits to our chart which represent the expected variation we expect to see around any given year. You can see the difference in the average no-hitters in the 2010’s at 5.0 being much higher than what we have seen so far in the 2000’s at 1.5 no-hitters. For the 2010’s decade we can see much higher expected top end of no-hitters, as seen in the UCL (upper control limit), of up to 11.7 no hitters. Which means we may have hope of experiencing a truly record breaking no-hitter count of above seven games before the 2010 decade is over!
So lastly after showing that a trend does seem to exist in the rise of no-hitters, we naturally want to know what is causing this surge? Mike Oz at Yahoo Sports offered up a few good theories on the rise of no-hitters in the 2010s. The most popular cause often sited is that offensive numbers (hits, homers and runs) are down across the league. But this is a tougher case to prove as while some teams have seen their offensive output take a nose dive (from Atlanta to New York), several teams have seen their offensive output improve greatly over the years (from Houston to Toronto)! The other probable cause Mike offered (that brings a smile to my face) is the fact that perhaps pitchers and defenses are much better prepared to face opposing team batters due to the huge growth of baseball player and game situation statistics and analysis. Therefore, knowing the best way to pitch to a batter and even changing the positioning of defensive players for specific batters can give the pitcher ands team the edge in preventing hits!
While theories on the causes of the increase in no-hitters will be hard to prove out, it is clear that we are in a period of increasing and potentially record breaking no-hitters occurring each season! So keep an eye out as we move toward the finish of this baseball season and start of the next one. More no-hitters are coming and you might just get to see a one thrown by your favorite team!
You must be a registered user to add a comment. If you've already registered, sign in. Otherwise, register and sign in.
- © 2025 JMP Statistical Discovery LLC. All Rights Reserved.
- Terms of Use
- Privacy Statement
- Contact Us