cancel
Showing results for 
Show  only  | Search instead for 
Did you mean: 
The Discovery Summit 2025 Call for Content is open! Submit an abstract today to present at our premier analytics conference.
Get the free JMP Student Edition for qualified students and instructors at degree granting institutions.
Choose Language Hide Translation Bar
View Original Published Thread

Building a design space using JMP 17's new feature "Design Space Profile"

undefined

In the current latest version "JMP 17", it is available as an option in "Prediction Profile". "Design Space Profile" This feature has been added.


undefined


This feature allows "When modeling the relationship between Y (response) and X (factor), find a rectangular region of the factor that falls within the specification limits of the response" However, what was the purpose of this feature in the first place? What exactly is a design space? We will provide explanations including questions such as:


"Design space" is a term used in drug development, and this function is designed with this in mind. However, we believe that even those who are not involved in drug development will find it useful.


What is Design Space?

In drug development, the concept of QbD (Quality by Design) is advocated. In order to ensure the quality of pharmaceuticals, the idea is to properly understand and respond to risks at the design stage.The ICH-Q8 guidelines (formulation development), which are the origin of this concept, define the design space as follows: It is written as follows.


design space :

Multidimensional combinations and interactions of input variables (such as raw material properties) and process parameters that are proven to ensure quality. Operating within this design space is not considered a change.


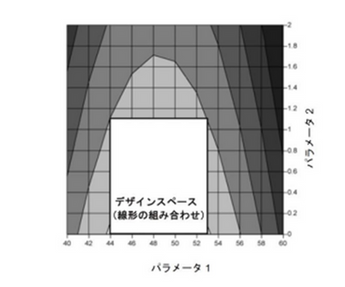
The guidelines also provide an example of how to present a design space, as shown below.

undefined

Source: ICH-Q8 Guidelines for Formulation Development


This is an image that shows contour lines for the predicted value of the dissolution rate by applying a response surface model to factors that affect the dissolution rate of the tablet (amount of additives, water content) during the granulation process. The area where the elution rate is 80% or more is a curved line, and a rectangular area within this area is cut out and used as the design space.


Use case

Consider the following example with two responses and two factors.


Response (Y)

Dissolution(%) : Elution rate, preferably 80% or more

Uniformity of Content(RSD%) : Content uniformity (relative standard error%), preferably 4% or less


Factor (X)

PSD d90(μm): 90% point of particle size distribution (10-30)

Disintegrant(%): Disintegrant percentage (1-3)


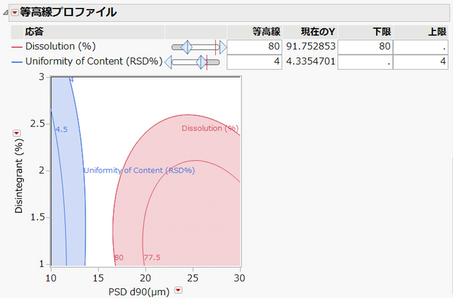
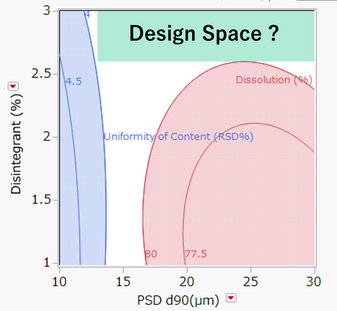
We conducted an experiment based on the design of experiments, fitted a response surface model to each Y, and The area (white part) that satisfies the Y specification range is shown in a contour profile.


undefined


The design space will be set based on the management strategy and also taking practical aspects into consideration. There is an advantage that operating within a space is not considered a change, so you want to set up a space as wide as possible.


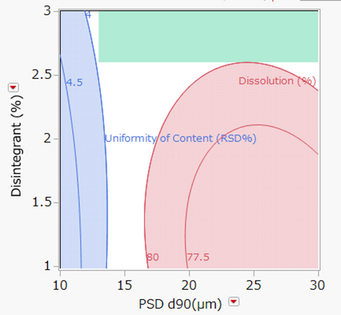
If you were to cut out the last-minute area, the following green area would look good.


undefined


However, it is important to note that the contour lines obtained here are drawn relative to the predicted values determined by the estimated model. There is a prediction error for the prediction. For this reason, there is a belief that it is dangerous to go beyond the limits, and I myself have been asked many times by customers regarding this point.


One way to deal with this is to find a confidence interval for the average (or prediction) and construct a region based on its lower and upper bounds, but here we introduce the ``Design Space Profile.''


Using “Design Space Profile”

In the design space profile, first specify the LSL (Lower Specification Limit) and USL (Upper Specification Limit) of the response. Then, set the lower limit and upper limit of the factor graphically or enter it in the input box, and consider the output percentage within specifications and volume percentage.


undefined


Percentage within specifications : Probability that the response will fall within the specification limits given the current limit setting for the factor.

volume percentage : Relative percentage of the area due to the current factor limit setting (``PSD d90'') when the area of the first factor (in this example, ``PSD d90'' is 10-30, ``Disintegrant'' is 1-3) is 100%. If you narrow ``Disintegrant'' to 13 to 30 and 2.65 to 3, the area will be narrowed to about 14.4% of the initial factor area)


This example shows that Y is within the specification range 90.9% of the time.


Since we want to increase the probability a little more, let's set the lower side of Disintegrant to 2.8 and narrow the range. The graph on the left shows how the proportion within specification changes when specification limits are set for each factor, so it is a good idea to look at this while setting the limits.


undefined


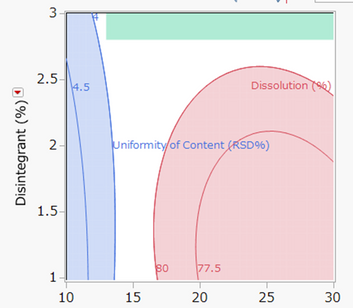
Since the area has been narrowed, the volume ratio has decreased to 8%, but the within-specification ratio has increased to 95%. If this area is plotted as a contour line, it will look like this:


undefined


Although this is not an area where we are on the verge of attacking, it appears to be a safe area, a so-called conservative area, considering the prediction error. This is how you use "Design Space Profile" conservative design space can be built.


How do you find the probability that it falls within the specifications?

The within-specification ratio is determined by Monte Carlo simulation. Therefore, it can be obtained even when modeled using a complex model such as a neural network.


Main steps of simulation

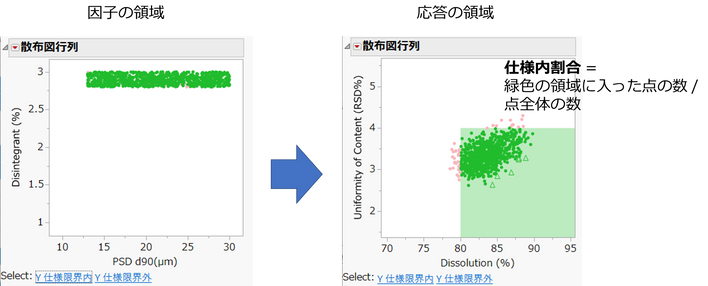
  1. Generates a large number of random numbers (10,000 by default) uniformly distributed within the domain of the factor. Among them, consider the point at the specification limit of the set factor (lower left figure: group of points).
  2. For each green point, substitute the value into the response surface equation and add the standard deviation of the model error (RMSE) as a random error to find the predicted value of Y.
  3. Count the number of predicted values of Y that are within the specification limits and calculate the percentage of all points. In the lower right image, green dots indicate that Y is within the specification limits, and red dots indicate that it is not.


undefined


JMP has an option called "Simulator" in the prediction profile, but this generates random numbers within a range of predetermined factors and calculates the percentage of Y that does not fall within the specification limits (nonconformity rate). On the other hand, the design space profile is the opposite. We are looking for the percentage of compliance.


It's okay if there are many factors

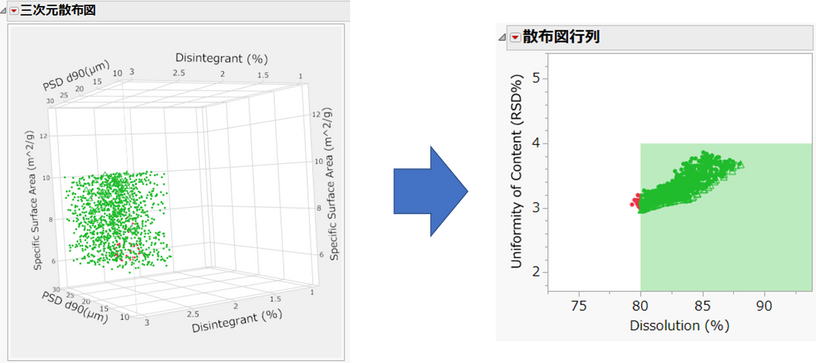
Up to this point, we have dealt with a two-factor example for ease of explanation, but of course Cases with three or more factors can also be handled. The figure below shows the design space profile when a three-factor response surface model is fitted, with the specific surface area ("Specific Surface Area") added as a factor in addition to the previous two factors ("PSD D90" and "Disintegrant"). With three or more factors, it is difficult to visualize a rectangular area using two-dimensional contour lines, so this function is useful.


undefined


In the case of 3 factors, the predicted value of Y is obtained by generating uniform random numbers in the 3-dimensional factor area as shown in the lower left figure.


undefined


by Naohiro Masukawa (JMP Japan)

This post originally written in Japanese and has been translated for your convenience. When you reply, it will also be translated back to Japanese.

Comments
yuzawaomine
Level III

デザイン スペース プロファイルの活用事例を紹介して頂けると助かります。