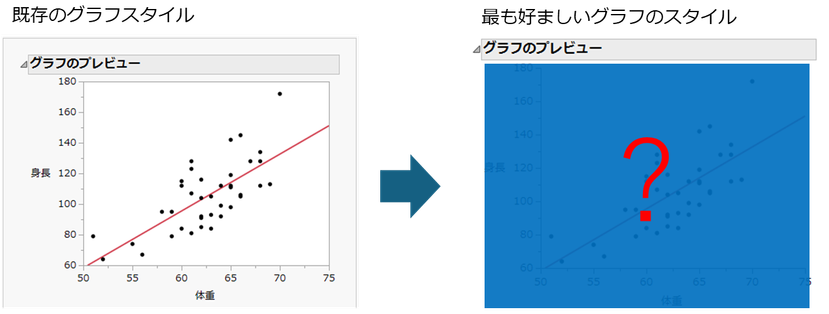
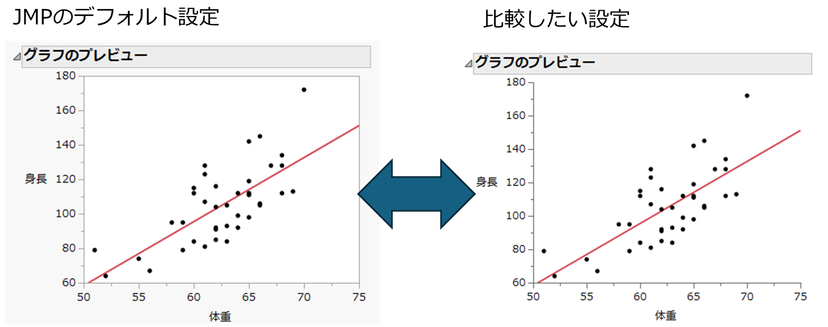
Which graph do you prefer? We present two graphs (A and B) to JMP users and ask them to choose the one they prefer. We then present them with a different pattern of graph and ask them to choose the graph they prefer in the same way.
This is a situation where you are conducting a " choice experiment " in which you choose the most preferred option from several options. Through a choice experiment, you can find out which style of graph is most preferred.
In fact, last year we conducted this choice experiment with Japanese customers and held a seminar to analyze the results. In this blog, we will introduce the content of the choice experiment and an overview of the results.
A survey of JMP graph styles
The purpose of the study was to find the most favorable combination of settings for the following four styles (① to ④) of graphs output by JMP.
style |
Choices |
①Graph border |
Yes, no |
②Scale position |
Outside , inside |
➂ Window background color |
White, light grey , dark grey |
④Frame border |
Yes , no |
The options in red in the table are the JMP default settings. Are these really the best settings?
What is a selection model?
A model that conducts a choice experiment to investigate this question and analyzes the obtained data is called a " choice model ." This is also called "choice-based conjoint analysis."
Data from a choice experiment are modeled with conditional logistic regression to estimate the probability that a given configuration is preferred.
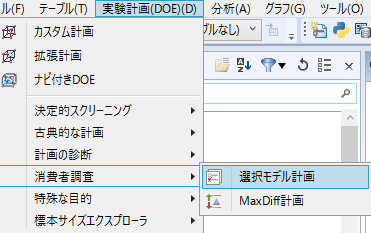
In JMP, the analysis is performed by creating a design table for a choice experiment in the Choice Model Design platform, entering the survey results into the design table, and fitting a choice model.
Analysis procedures and results
Creating a Choice Experimental Design
In a Choice Model Design, you first set the name of the attribute (in this case, the graph style) and the attribute levels (options).
For the final setting, “Generate Plan”, the following settings A and B are important.
A. Number of profiles per choice : Specify the number of graphs to compare at one time. Since we set it to "2" here, two graphs will be presented and you will be asked to choose which one you prefer.
B. Number of choice sets per survey : This is the number of questions. Here, we set it to "8", so you will be asked to choose between eight options to choose which one you prefer.
Conduct a survey based on the planning table and enter the survey results (responses)
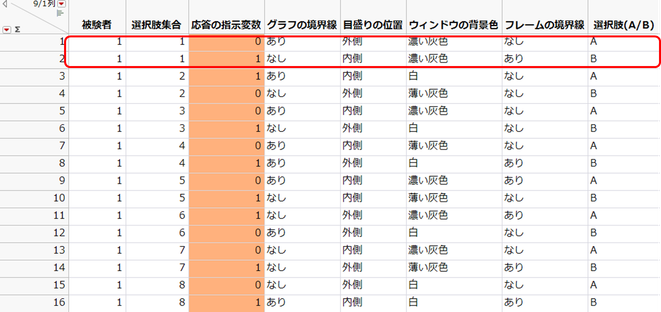
Conduct a survey based on the design table and enter the results in the data table. The table below shows the results for one respondent. There are eight choice sets, and each choice set has two answer options (A and B), so there are 16 rows.
In the column "Response indicator" (the column shaded orange), enter "1" for the answer choice and "0" for the answer choice not chosen.For example, in the area highlighted in red in the figure below, the respondent chose option B as their first option (A or B), so in the "Response indicator" column, "0" is entered in the first row and "1" in the second row.
Repeat this process for each respondent. 97 people responded to this survey, so we created data for 97 people. For reference, we have attached a graph of each option (8 patterns) and the distribution of their answers as a document to this blog (Choice_Results.pdf).
Fitting the Selection Model
Click the script "Selection Model" included in the data table to fit the selection model. The report obtained is as follows.
The term " utility " appears in conjoint analysis, such as choice models, but here it can be understood as "satisfaction with the graph."
The report "Parameter Estimates" shows the estimated coefficients and standard errors that indicate how much each item affects utility (called partial utility).
The report "Likelihood Ratio Test" shows the results of the significance test for each factor. In this example, the two factors that are significant at the 5% significance level are "graph border" and "frame border." In other words, it is thought that the difference between having or not having a graph border or a frame border affects the utility.
Utility Profile
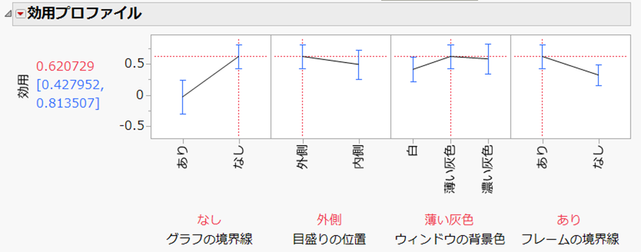
The following "utility profile" is a graph of predicted utility values for each factor (style) level (choice). This graph allows you to see how utility changes when you change the choice. The predicted utility values are calculated from the parameter estimates (partial utilities) mentioned above.
The settings to maximize utility (i.e. maximize the satisfaction of the graph) are as follows:
Graph border : None
Scale position : Outside
Window background color : Light gray
Frame border : yes
This is the JMP default setting! From the 97 responses, we found that the JMP default setting was the best style after all.
Now let’s find the probability that each graph will be selected when comparing the JMP default settings with a setting without frame borders.
You can verify this by selecting the Probability Profiler option. In the bottom section, select the JMP default settings as the "baseline," and in the profile section, select the level of the settings you want to compare.
The probability (vertical axis) in this case is displayed as 0.376. This gives the probability of each choice as follows:
Probability that JMP's default setting is chosen : 0.624 (1 - 0.376)
Probability that the setting you want to compare will be selected : 0.376
Although not shown here, the Multiple Choice Profile option allows you to calculate the choice probability for three or more style settings.
For now, I'm relieved to have concluded that the JMP default settings are the optimal graph settings.
by Naohiro Masukawa (JMP Japan)
Naohiro Masukawa - JMP User Community
You must be a registered user to add a comment. If you've already registered, sign in. Otherwise, register and sign in.