cancel
Showing results for 
Show  only  | Search instead for 
Did you mean: 
The Discovery Summit 2025 Call for Content is open! Submit an abstract today to present at our premier analytics conference.
Get the free JMP Student Edition for qualified students and instructors at degree granting institutions.
Choose Language Hide Translation Bar
View Original Published Thread

What I noticed when visualizing the ball speed and angle of Dodgers player Ohtani

Otani, who moved to the Dodgers on a big contract this year, achieved astonishing results as a batter, hitting 54 home runs and stealing 57 bases.

This year, he has been churning out home runs with his spectacular power, but I was a little curious, so I tried to visualize the hit ball speed and angle of his home runs from the regular season this year (2024) and last year (2023).

The left side of the graph below shows the exit velocity and launch angle for this year's 54 home runs, and the right side shows the exit velocity and launch angle for last year's 44 home runs.

undefined

*Data source: Otani's home run data extracted from Baseball Savant

This figure also includes density (contour lines in JMP) to represent the distribution, and the difference between this year and last year can be seen.Looking at this year's contour lines, we can see that they are split into two groups.

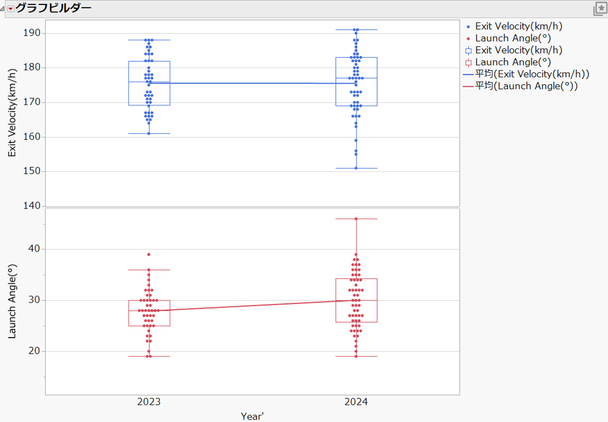
Next, let's take a closer look at the distribution of ball launch speeds and angles from last year and this year. The upper graph (blue) in the figure below shows the distribution of ball launch speeds, and the lower graph (red) shows the distribution of ball launch angles. For reference, the averages from last year and this year are shown as lines.

undefined

The average launch speed is the same this year as last year at 175.5km/h, but there is more variance this year. On the other hand, the average launch angle is higher this year (27.9° last year, 30.0° this year), so there is more variance this year.

This year's home runs are divided into two groups

This year's hit ball speeds and angles were classified into two groups using (hierarchical) cluster analysis.

Group 1 ( orange , N = 25): LA: High, EV: Low (on average) slower ball speed and higher angle

Group 2 ( purple , N = 29): LA: Low, EV: High (on average) Faster ball speed and lower angle

undefined

Group 1 is the case where the ball was hit in a high parabolic trajectory and became a home run, while Group 2 is the case where the ball was hit at a high speed and became a home run in a shape similar to a liner.

In baseball, there is an index called the " barrel zone " that measures the efficiency of hitting by the ball's speed and angle. According to this index, the angle has little effect when the ball is hit fast, but when the ball is hit slow, an appropriate angle is required. For example, when the ball is hit at 98 mph (158 km/h), the barrel zone is 26 to 30 degrees, but when the ball is hit at 116 mph (187 km/h), the barrel zone is 8 to 50 degrees.

Based on this thinking, we can say that Group 1 had a number of home runs that were outside the barrel zone, and although the hits were not efficient, there were still some cases where they resulted in home runs.

What determines the trajectory of a home run?

So what are the factors that separate these two groups? Here are six that seem obvious:

variable scale explanation
First half/Second half name First half: Pre-All-Star Game, Second half: Post-All-Star Game
release_speed continuous (the speed of the ball that hit a home run)
release_spin_rate continuous (Number of rotations of the ball that hits a home run)
p_throws name Opposing pitcher's left and right
Strike/Ball name Zone of the hit ball (strike, ball)
Home/Away name Home games, away games

We examined the relationship between these variables and the home run groups mentioned earlier.

First, use [Bivariate Relationship] and specify the group (of home runs) (nominal scale) as Y and the above six variables as X. If X is a continuous scale, the "Logistic Fit" report will be displayed, and if X is a nominal scale, the "Contingency Table Analysis" report will be displayed.Here we show the top two of the six reports displayed when you run the "Show in order of best fit" option.

undefined

In the logistic regression report on the left, the x-axis is the ball speed (release_speed). We can see that the faster the ball speed, the higher the probability of being classified into group 2 (faster release speed, lower angle). This suggests that the faster the ball speed, the faster the return release speed.

The contingency table analysis report on the right shows that the proportion of Group 2 was higher before the All-Star game (First), while the proportion of Group 1 was higher after the All-Star game (Second). However, the difference is not statistically significant.

Based on these results, we created a “partition” (decision tree) to predict group differences.

While it's great that Ohtani hit 54 home runs, this may be a bit of a small amount of data to use as a partition. However, as an exploratory analysis, I will show some of the results. First, I split by pitch speed (79.7 mph), and then I split by the pre- and post-All-Star games for the group with pitch speeds above 79.7 mph.

undefined

We can see that of the 49 home run data points with ball speeds of 79.7 mph or faster, the group on the left has a higher proportion of Group 2 (=0.6923), while the group on the right has a higher proportion of Group 1 (=0.5217).

In other words, even in cases where the ball speed is fast, after the All-Star game, there are more cases where the ball's exit speed is slower and the ball is hit at a higher angle and results in a home run.

So I used the magnifying glass tool to enlarge the graph of ball speed and angle, and changed the plot points to home run numbers. The first home run after the All-Star break was home run number 25, but Group 1 contains many home runs after that.

undefined

Some of you may remember seeing a few high-trajectory home runs in the second half of the season.

Not limited to home runs, Ohtani's barrel rate (the percentage of batted balls that land in the barrel zone) this year is second in the majors (21.5%), second only to Yankees' Judge. We can see that he has been hitting efficiently throughout the season, but looking specifically at home runs this year, it seems that there has been an increase in the number of home runs that have been hit even with inefficient hitting. Does this also indicate Ohtani's overwhelming power?

by Naohiro Masukawa (JMP Japan)

Naohiro Masukawa - JMP User Community

This post originally written in Japanese and has been translated for your convenience. When you reply, it will also be translated back to Japanese.