cancel
Showing results for 
Show  only  | Search instead for 
Did you mean: 
The Discovery Summit 2025 Call for Content is open! Submit an abstract today to present at our premier analytics conference.
Get the free JMP Student Edition for qualified students and instructors at degree granting institutions.
Choose Language Hide Translation Bar
View Original Published Thread

How to draw a contour profile with color gradation

JMP's "Contour Profile"

JMP's "contour profile" allows you to display the prediction formula of the fitted model as contour lines and examine the relationship between factors (X) and characteristic values (Y).


Particularly in the development and manufacturing stages of pharmaceuticals, the QbD (Quality by Design) concept recommends constructing a design space* by expressing the relationship between factors and characteristics using contour lines using the experimental design method. At that time, JMP often uses the "contour profile" shown earlier.


*Multidimensional combinations and interactions of input variables (such as raw material properties) and process parameters that are proven to ensure quality (from ICH Q8)


Sometimes from Japanese customers I want to display the predicted response values with a color gradation as shown below in the "contour profile" We sometimes receive requests for this.


undefined


Unfortunately, in JMP, there is no option to add a color gradation like the one above in the "contour profile".


Even in the case of multi-characteristics (multiple Y), "contour profile" can be drawn by overlapping multiple characteristics as shown below.


undefined

At this time, if you can add color gradation to multiple characteristics, This will result in a graph that is difficult to understand.


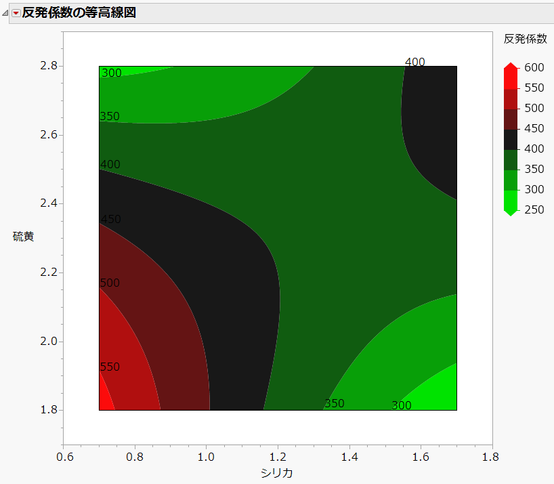
Contour lines of color gradation drawn with "contour map"

In order to draw the contour lines with the color gradation shown above in JMP, you will need to make some ingenuity.


As an example, suppose you use JMP's sample data "Bounce Data.jmp" and apply a response surface model to characteristic Y "coefficient of restitution", and you want to make the response surface contour lines with color gradation.


Start by displaying the "contour profile" in the [Model Fit] report.


The contour lines displayed here are drawn with "silica" on the horizontal axis and "silane" on the vertical axis when the value of the factor "silane" is fixed at 50.


undefined


Operation to create color gradient contour lines

1. From the red triangle button to the left of the report "Contour Profile" [Simulator] Select , change the ``number of repetitions'' to 1, change the silica and sulfur sequence to ``arithmetic progression of position parameter'', and set the number of steps to 100, as shown in the image below. (In this example, silane is a factor whose value is fixed, so the numerical sequence remains "fixed".)


2. Under "Simulator" [Create table] Click the button.


undefined


Then, the data table shown on the right side of the figure above will be output. This data table was created as follows.


Divide the range of "silica" (0.7-1.7) into 100 pieces at equal intervals

Divide the "sulfur" range (1.8-2.8) into 100 equally spaced pieces.

⇒ Create 10,000 (=100×100) grids with silica on the horizontal axis and sulfur on the vertical axis, and enter the predicted value for each grid into "coefficient of restitution"


3.For the data table created in step 2. [Graph] > [Contour Plot] Select , specify [X] and [Y] as shown below, and check "Fill display area".


undefined


A contour map will be created. If necessary, right-click the legend displayed on the right side and specify the color theme, number of labels (how many colors to divide), etc.

undefined


To display further value labels on the contour lines, click the red triangle button at the top left of the report. [Contour label] Choose.


Color gradient contour lines drawn with graph builder

Above, we showed how to operate using the "Contour Plot" platform, but you can also use "Graph Builder" to create a data table for the data table created in step 2.


undefined


Which one is better depends on your preference, but please note that "Graph Builder" has display limitations compared to "Contour Plot", such as not being able to add value labels to contour lines.


by Naohiro Masukawa, JMP Japan

This post originally written in Japanese and has been translated for your convenience. When you reply, it will also be translated back to Japanese.