A common question that comes up with Interactive HTML output is "Why is this report just an image?" We attempt to provide feedback in the Log to give a high-level indication of why. Not familiar with the log? You can access it in Windows by going to View > Log (or pressing CTRL+SHIFT+L), or on the Mac by going to to Window > Log (CMD + 1). The Log can include script output when working with JSL as well as informational output such as the messages output when exporting Interactive HTML. We avoid messages that are so vague that they frustrate power users and statisticians and messages that so specific that they sound like gibberish to less technical users. Hopefully, the messages are informative, and are useful to provide to Technical Support if you are requesting something be implemented in interactive HTML or reporting a problem. Below, I decode the most common causes for Profilers to come out as static images.
Reason 1: Categorical response
I mentioned this above, but currently only continuous responses are supported. If you have tried to model a categorical response and save to Interactive HTML or publish to JMP Live, you will get the message "Interactive HTML: Profiler with categorical response <column name> is not interactive" in the log.
Reason 2: Unsupported JSL commands
The JMP Profiler evaluates a mathematical formula with multiple factors, varying one while keeping the others fixed to produce a curve for each factor. Internally, the formula is a JSL expression, such as what you find when you view the properties of a column with a formula. JSL is a large language with many commands and operations. Some are too programatically intensive to perform in the browser, which might perform badly.
Also, we are trying to implement the most widely used subset and will add features judiciously as we understand the demand for them from you, the user. In JMP 12, the same 50 or so commands implemented in Flash were ported: Add, Subtract, Multiply, Divide, Minus, Power, Root, Abs, Floor, Ceiling, Min, Max, Equals, NotEquals, GreaterThan, LessThan, GreaterThanOrEqualTo, LessThanOrEqualTo, Or, And, Not (negation), Exp, Log, Log10, Sine, Cosine, Tangent, SinH, CosH, TanH, ArcSine, ArcCosine, ArcTangent, ArcSinH, ArcCosH, OpArcTanH, If, Match, Choose, and a number of Financial calculations DDB, FinFV, FinIPMT, FinIRR, FinMIRR, FinNPER, FinNPV, FinPMT, FinPPMT, FinPV, FinRATE, FinSLN,FinSYD.
In JMP 15, six additional ones were added (Is Missing, Zero or Missing, IfMZ, Modulo, Ln and Log1P), mostly because they were heavily used by the Partition, Boosted Tree and Bootstrap Forest platforms. There is no point in doing the work to enable a new embedded platform if the formulas it typically produces are not supported yet due to unimplemented JSL commands, so these had to be implemented first. If a command we haven't gotten to is encountered, the log will display the message "Interactive HTML: Profiler for <column name> is not interactive because of unsupported operations."
Reason 3: Unsupported platforms
If you go to Preferences > Platforms in JMP, you will see more than 100 platforms listed, many of them with Profilers. Not counting the Prediction Profiler platform (found in Graph> Profiler), eight platforms are now supported. Again, we started with what we felt were the most widely used, and we want to hear from you if there is a platform you need that isn't supported. If your platform comes out static, look in the log and it will say "Interactive HTML: Embedded profilers in this platform are not interactive."
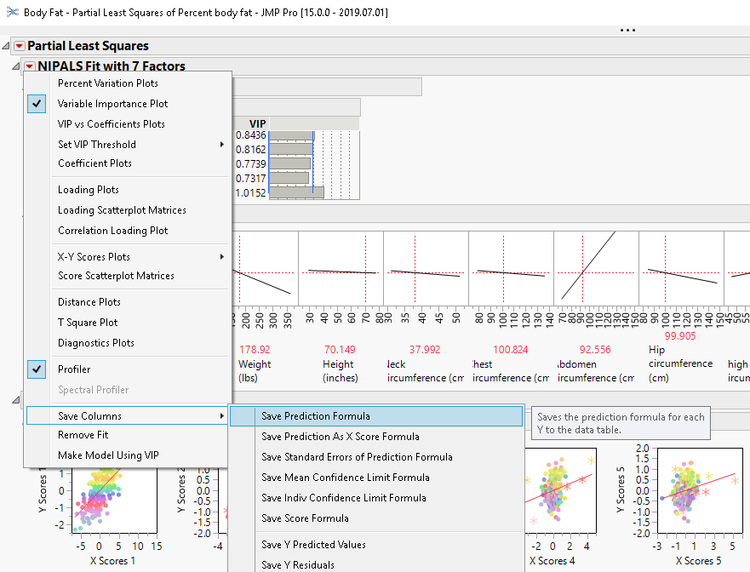
If you get this message in the log, there may be a workaround. For many platforms that have a Profiler, the red triangle menu will provide a "Save Columns" submenu with "Save Prediction Formula" as an option: Demonstrating the Save Prediction Formula option in the Partial Least Squares platform.
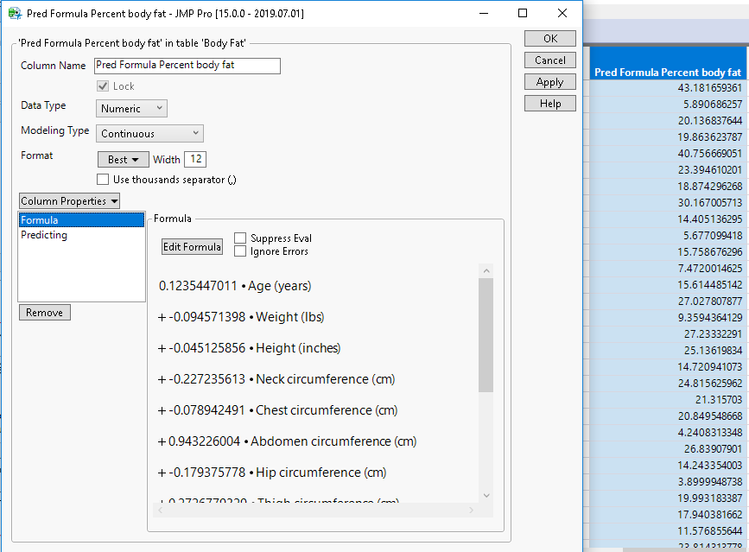
Using the Body Fat sample data set, run the "Partial Least Squares" script and add the Profiler from the red triangle menu for "NIPALS Fit with 7 Factors". If you were to export this, you would get a static image -- we haven't gotten to enhancing the Partial Least Squares platform yet to export the Profiler to Interactive HTML. However, if you go to that same red triangle menu and select Save Columns > Save Prediction Formula, it will create a new column "Pred Formula Percent body fat". Prediction column saved to the data table. By viewing the column's properties you can see the formula of the profiler.If you view the Column Properties, you can see there is nothing complex about this formula -- simple multiplication and addition. If you open up the Graph > Profiler menu and add this column for Y, you get a standalone Profiler that does export to Interactive HTML or JMP Live. Because of the number of factors, I chose to go to the red triangle menu and make use of the Arrange in Rows feature (found under the Appearance submenu) to make the Profiler wrap into two rows with a value of 7.
Reason 4: Advanced features
For individual embedded Profilers, there could be additional features that aren’t supported specific to that platform:
- Non-mixture linear constraints
- Random effects
- Multiple response variables
- Noise factors
- Offset variables (this is specific to Generalized Linear Model)
If you encounter one of these, you will get a message in the log that should explain, for example: "Interactive HTML: Profiler with non-mixture linear constraint is not interactive."
We continue to improve the output of the very popular Profiler feature in Interactive HTML. Hopefully, this blog post helps to explain some of the cases that we haven't implemented yet.
We want to hear from you about the features and embedded platforms you would like to see -- leave me a comment!