We may have said goodbye to JMP Genomics last year, but fear not, the new version of JMP Pro 17 handles many of your -data analysis needs. While you will find nearly all of JMP Genomics’ functionalities in JMP Pro, you may need to change your way of thinking when using these features. In this blog, I want to share my experience of how to deal with gene expression data in JMP Pro.
In JMP Pro, there are six platforms that are especially useful: Hierarchical Clustering, Multivariate Embedding, Response Screening, Predictor Screening, Cluster Variables and Model Screening.
Gene expression data in molecular biology refers to measuring the level of activity of genes in a biological sample, such as cells or tissues. It provides valuable information about which genes are active, how they are regulated, and how they interact with each other in different conditions and diseases.
Formatting your data
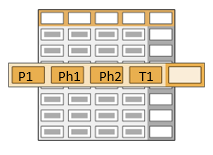
For each omic data analysis in JMP Pro, such as gene expression data, metabolic expression data or genotypes data, the data sets need to be in the following format:
- Each specific sample should have its own row that lists the various observations, such patient (P1), its phenotypes (Ph1, Ph2), its traits (T1), etc.

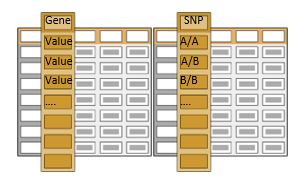
- Each variable or column is the measurement of one specific gene expression (for gene expression data), or a genotype of one particular SNP or allele (for genetics data).

Gene expression data
The goal of gene expression data is to find significantly differential expressions of genes or messenger RNA between different traits or patient treatments. The source of the data can differ; it can come from microarray, NGS (next gene sequencing), PCR, etc. In general, the input data looks very similar, as each patient comes with gene expression measurements that are numerical values reflecting the abundance of the messenger RNA in the cells or tissue. The idea is to find expression of genes that differs in the cells/tissues from one trait/treatment to another.
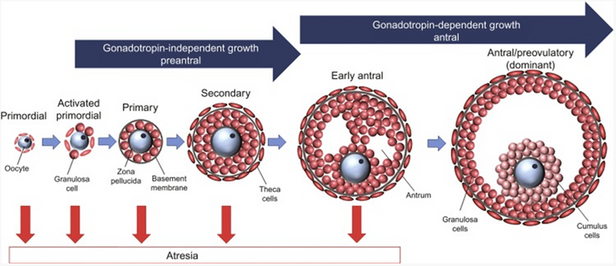
The data set GSE 34317 has been used for the following example. The data represents two different tissue/cell types (granulosa and theca) at three different preovulatory follicle development stages – secondary or selection, early antral or differentiation, antral/preovulatory or luteinization – among two different animals (cow and heifer).
The article referenced can be found here.

Image source: Ovarian Follicle - an overview | ScienceDirect Topics
After data cleaning, the remaining data contains 19k variables (genes) and 65 samples:

The aim of this experiment was to determine the effects of metabolic/lactational environment on the differential expression of genes in theca and granulosa cells at three distinct stages of preovulatory follicle development between lactating dairy cows and nulliparous heifers. With the help of JMP Pro 17, the following workflow was applied:

In Part 2, 3 and 4 of this post, I will explain how each step of the workflow was implemented. Stay tuned.