JMPer Cable
A technical blog for JMP users of all levels, full of how-to's, tips and tricks, and detailed information on JMP features- JMP User Community
- :
- Blogs
- :
- JMPer Cable
- :
- How to make JMP Live reports more interactive
- Subscribe to RSS Feed
- Mark as New
- Mark as Read
- Bookmark
- Subscribe
- Printer Friendly Page
- Report Inappropriate Content
Although many types of JMP graphics are currently interactive in the latest version of JMP Live, sometimes specific options within a JMP platform prevent full interactivity when enabled. By using an incremental approach, it may be possible to slightly adjust the appearance of a graph in order to obtain better interactivity on JMP Live.
JMP Live output is built using an HTML5 foundation. What does that mean? It means that while there are additional features beyond HTML5 found on JMP Live (for example, the inclusion of filtered rows in calculations used to regenerate graphs on the server), many of the interactivity tests can be performed without JMP Live by examining only the HTML5 output.
Let’s examine two approaches for examining and remedying interactivity: interactively (no pun intended) and through the script editor. Both approaches will use the graphics generated by running the following example JSL script.
Names Default To Here( 1 );
dt = Open( "$SAMPLE_DATA/Big Class.jmp", Invisible );

jmpreport = NewWindow("Test",
    VListBox(
        DataFilterContextBox(
            HListBox(
                dt << DataFilter(Conditional, Count Excluded Rows(0), Local, Add Filter(columns(:age))),
                dt << GraphBuilder(
					Show Control Panel( 0 ),
					Fit to Window( "Off" ),
					X Group Edge( "Bottom" ),
					Variables(
						Y( :weight ),
						Group X( :age )
					),
					Elements( Box Plot( Y, Legend( 1 ), Jitter( "None" ), Box Style( "Solid" ) ) )
				)
            )
        )
    )
);
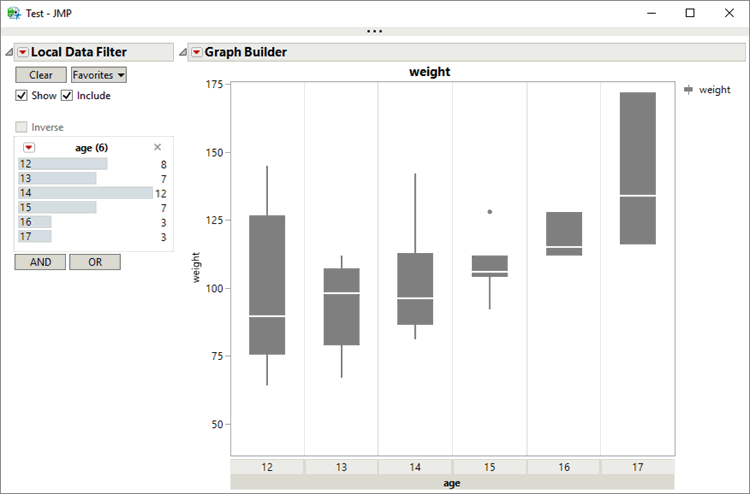
The result looks like this:
The Interactive Approach
One way to examine interactivity is through the Publish menu option. On any JMP window’s menu bar, click File > Publish. On the Select Reports window, check the Test box for the test results window. Notice the message immediately below the window list: “Interactive HTML is partially implemented for this report. Please see log messages.” This is the first clue that some aspect of your results may not be fully interactive.
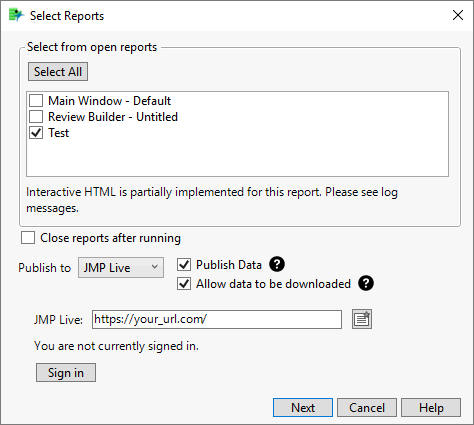
Inspect the log window (View > Log). Among other messages, you’ll see this one: “Interactive HTML: Box plot with solid style is not interactive.” Now you can focus on this specific graphical element.

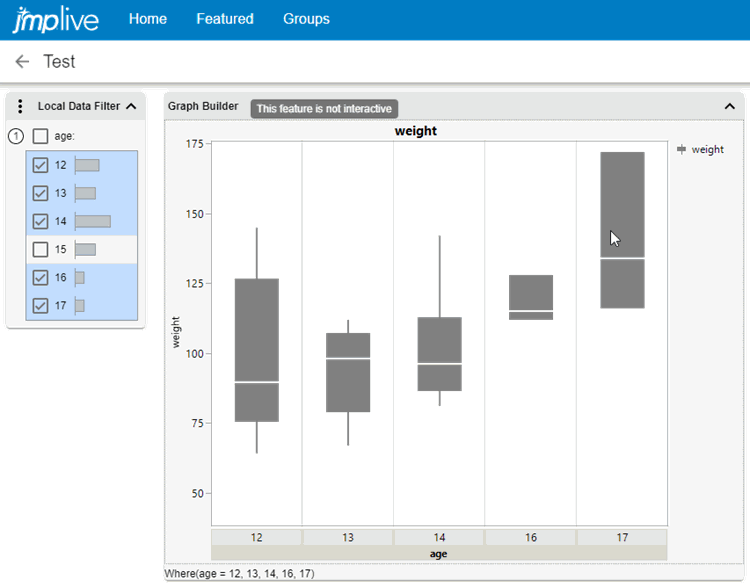
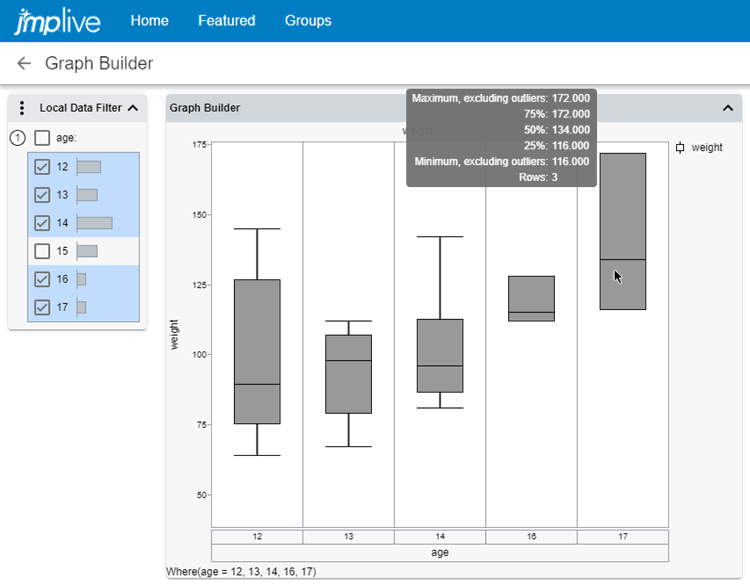
If you proceed to publish this report (either to File or to JMP Live) and hover your mouse pointer over a box in the box plot, you’ll see this tooltip: “This feature is not interactive.” (Although the boxes won’t have descriptive hover text for the corresponding data table rows, JMP Live still allows the graph to be redrawn based on filter selection changes in the Local Data Filter.)
In this instance, if you’re willing to choose a box plot style other than Solid, you can achieve better interactivity. Go back to your original Test window in the JMP client, right-click on a box in the box plot and choose Box Plot > Box Style > Normal.
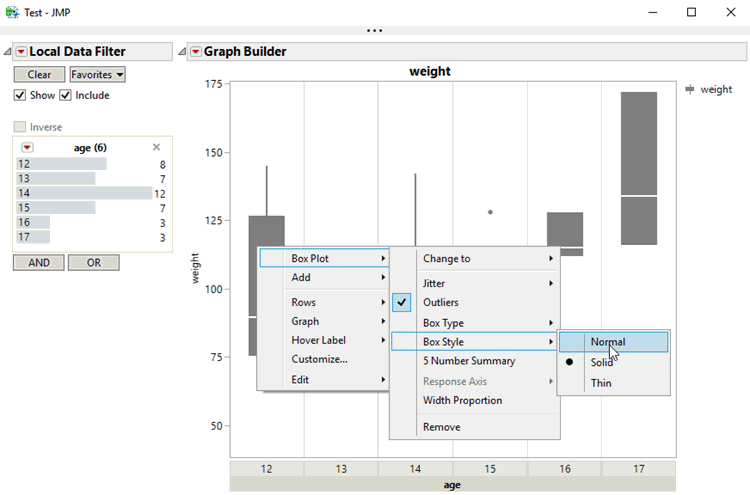
If you repeat the Publish process, you’ll see descriptive text for data points when hovering over the box plot.

The Script Editor
Another way to examine interactivity is through the script editor. Append the following code to the example script and run it to save the web report locally:
webreport = New Web Report();
webreport << Add Report(
	jmpreport,
	Title( "Test" )
);

url = webreport << Save("$DOCUMENTS/Test");

If( !Is Empty( url ),
	Web( url )
);
Alternatively, append and run the following code (substituting your actual URL, username, and API key appropriately) to publish to JMP Live:
webreport = New Web Report();
webreport << Add Report(
	jmpreport,
	Title( "Test" )
);

url = webreport << Publish(URL("https://your_url.com/"), username("your_username"), ApiKey("your_api_key"));

If( !Is Empty( url ),
	Web( url )
);
Inspect the log window. You will see the same messages that the interactive approach generated, including “Interactive HTML: Box plot with solid style is not interactive.”

When you inspect the report (either locally or on JMP Live) by hovering your mouse pointer over a box in the box plot, the tooltip “This feature is not interactive.” is revealed.

You can make the same fix as you did in the interactive method by simply updating the script directly in the script editor window. Specifically, change the GraphBuilder() > Elements() > Box Style() from Solid to Normal.
Elements( Box Plot( Y, Legend( 1 ), Jitter( "None" ), Box Style( "Normal" ) ) )If you re-run the script (which contains the Save or Publish message) and re-examine the output, you’ll see the descriptive box plot data point text when you hover over it.
Bonus Tip: Moving Between Interactive and Scripting Approaches
You can easily move between interactive and scripting methods. On most JMP graphics’ red triangle menu on the client, there is a command to reveal the script used to generate the graphics. Click Save Script > To Script Window.
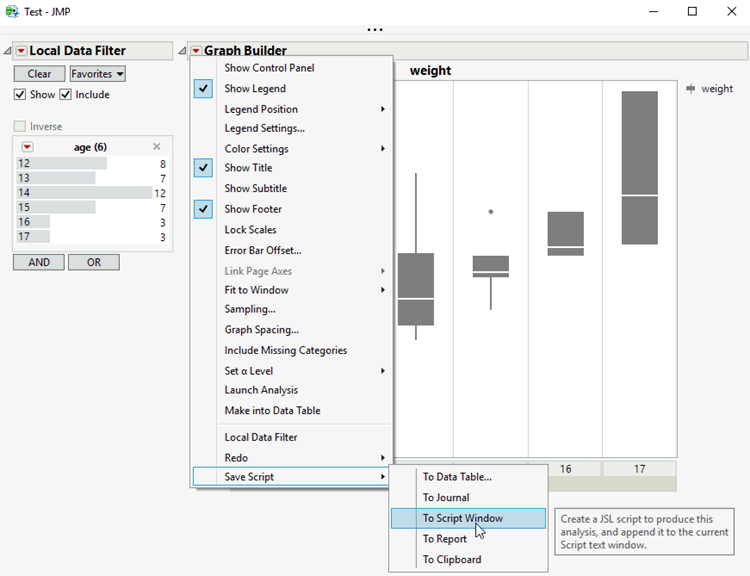
By doing so, you can open a new script window or append to the current script window with the script used to generate the graphics.

Similarly, when viewing the graphics on JMP Live, you can navigate to the Details section (click the button that looks like a lowercase ‘i’) and click the download buttons (the downward-pointing arrows) next to each data table or the JSL Script to save a local copy of them. (Note that these download buttons are available only if the Publish Data and Allow Data to be Downloaded publish options were specified.)
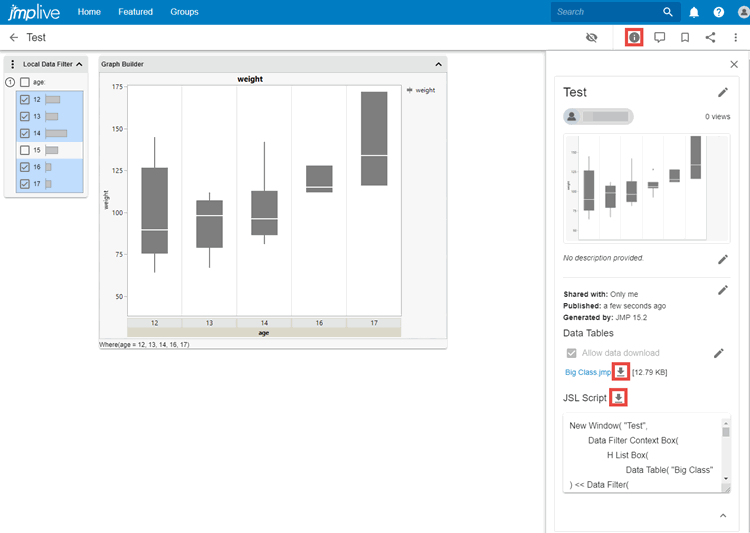
With both data table and script in hand, you can incrementally examine the effect of platform script option changes on the resulting interactivity, even if you were not the author of the script published to JMP Live.
- © 2026 JMP Statistical Discovery LLC. All Rights Reserved.
- Terms of Use
- Privacy Statement
- Contact Us

You must be a registered user to add a comment. If you've already registered, sign in. Otherwise, register and sign in.