As described in the Git documentation, the term “porcelain” refers to a user interface that is designed to be easy to learn and navigate. This post demonstrates how the high-level commands that implement the porcelain part of the Hover Label extensions feature can support drilling and further exploration of visualizations with just a few clicks (no JSL knowledge required!). The following examples use graphlet presets, Paste Graphlet and platforms with built-in graphlets.
Graphlet presets
With the addition of hover labels’ extended features, such as graphlets, you can drill down into visualizations for further analysis. To add a graphlet in a Hover Label, select the predefined graphlet preset, accessible via the right-click menu under Hover Label. These presets have dynamic graph role assignments, which they derive from the variables used within the graph. Presets are also preconfigured to be recursive to support drilling down.
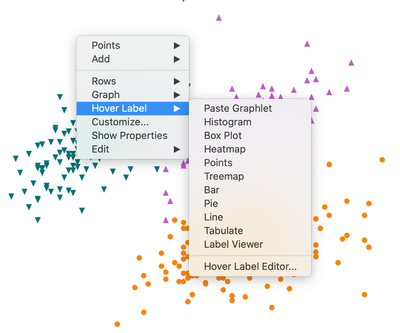
From the list, there are nine different preset options to choose from to help answer the question of what is behind an aggregated visual element. The Marker preset shows the exact values, whereas the Histogram, Box Plot, and Heat Map presets show a distribution of values. You can also break down and look at a graph with another category with the Bar, Pie, Treemap and Line presets. The Tabulate preset makes it possible to examine a table’s raw data.
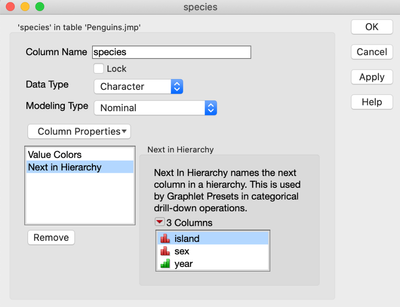
For preset graphlets that use categorical columns, select the Next in Hierarchy column property, found in the data table, to specify which columns will be used in the next level of a drill-down.
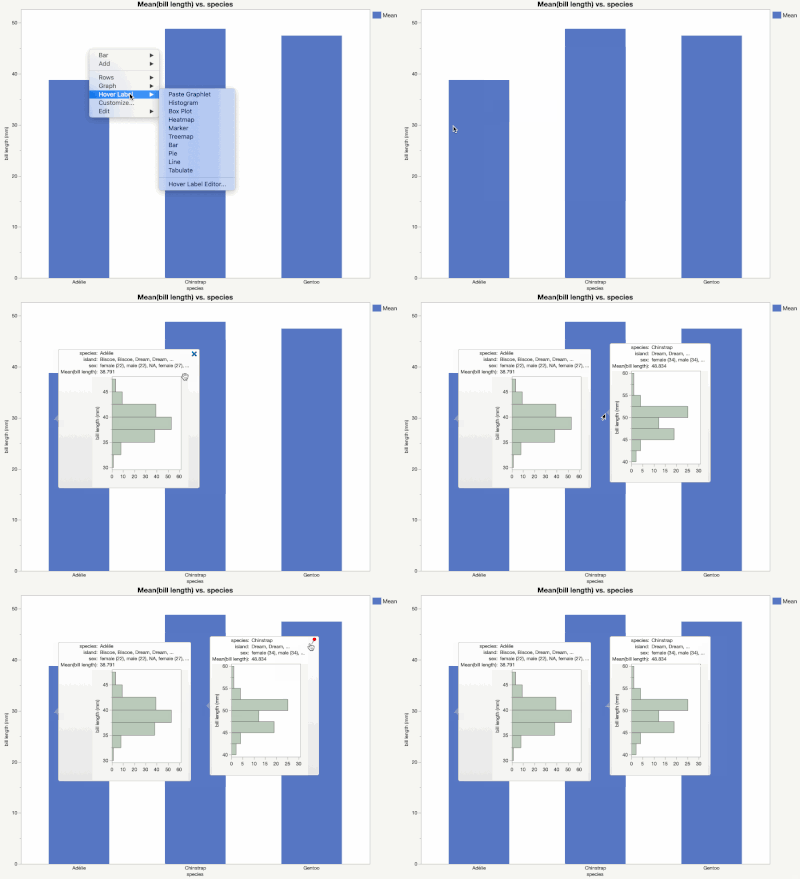
In the following animated gif, the Distribution graphlet preset is used to look at the distribution of bill lengths per species in the Penguins.jmp data table. After applying the preset and hovering over the bars, the distribution graphlet appears in the hover label. In the top-right corner of the hover label, there is a pin option that keeps the hover label present on the graph. Notice below that there are two pinned graphlet labels side by side, allowing for an easy comparison of the distribution of the data all in one chart.
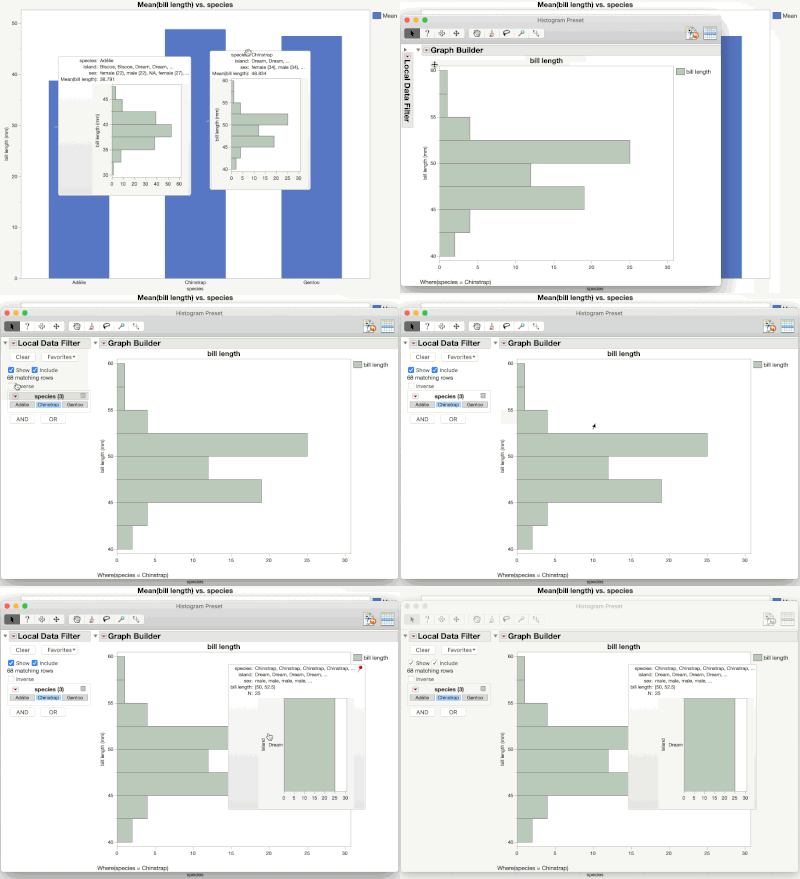
To take it a step further, click on the graphlet thumbnail, as shown in the animated gif below, to launch the graphlet in its own Graph Builder window and interact with the data visualization behind it. Also, in the launched graphlet window, there is a Local Data Filter (LDF) that facilitates filtering from the base graph; this LDF can be easily updated. And remember, the presets are recursive, so after applying the histogram graphlet preset, you can drill down multiple layers of data simply by hovering over an element in the launched graphlet window.
Paste Graphlet
To construct a graphlet from scratch instead of using a predefined graphlet preset, Paste Graphlet makes it easy to do in three simple steps:
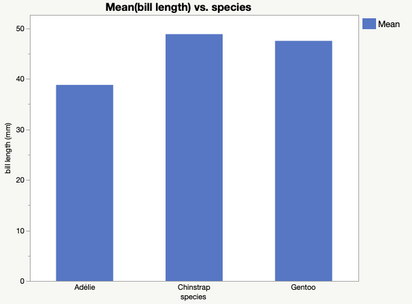
- Build both the base graph (left) and a graph that to use as a graphlet (right). NOTE: This is not exclusive to Graph Builder; any platform that supports an LDF can be used.
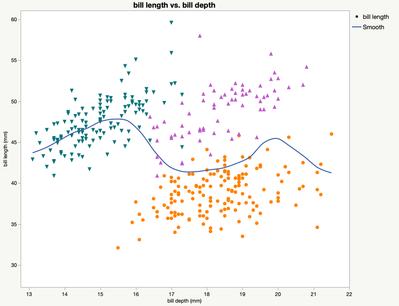
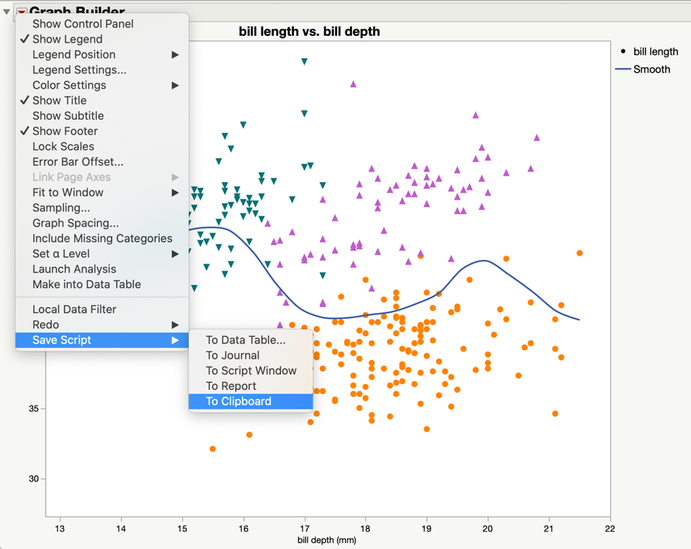
- Using the red triangle menu, save the script of the graph to the clipboard.
- Return to the base graph and right-click Hover Label to access the Paste Graphlet option to complete the operation for a graph with a custom-built graphlet.
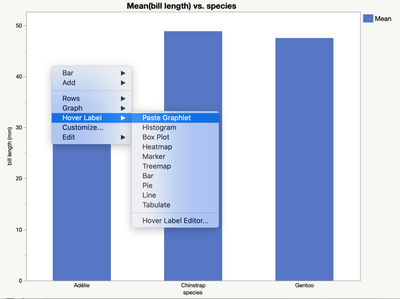
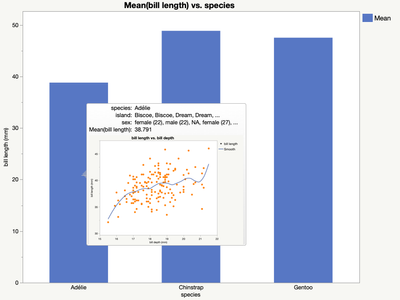
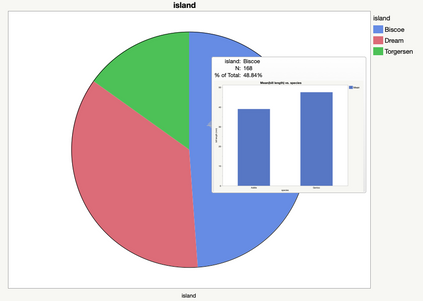
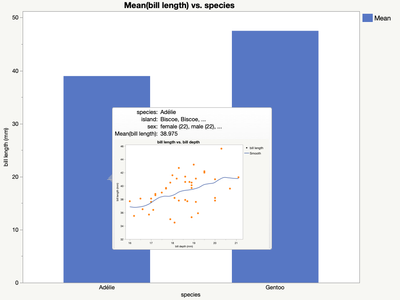
Unlike graphlet presets, Paste Graphlet will have static role assignments and will not be recursive, since its graphlets need to be drilled down one level at a time. However, by nesting Paste Graphlet operations from the bottom layer up to the top/base graph layer, you can create multiple, custom drill-downs. Continuing with this example, repeat the three steps, save the above bar graph with a pasted scatterplot graphlet to the clipboard and paste it on a new graph. By making a pie chart and pasting the script from the clipboard, there are three layers to the graph:
Built-in graphlets
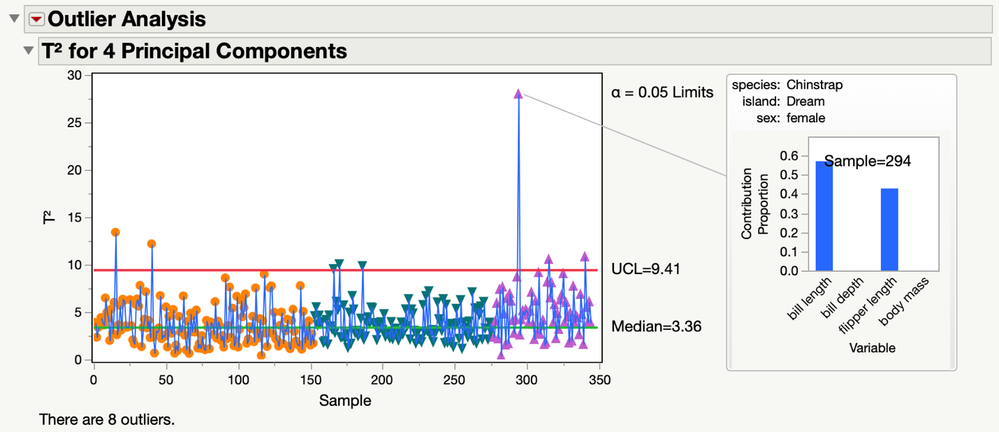
There are several JMP platforms that have preintegrated graphlets: Function Data Explorer, Process Screening, Multivariate Control Chart, Outlier Analysis of Principal Components, and Process Capabilities. Using Outlier Analysis of Principal Components, below is an example of a graphlet that is automatically generated when hovering over elements:
These examples are just a brief overview of the porcelain features that enable you to do some quick customizations with hover label graphlets in a matter of clicks.
Be sure to check out the next blog post in this series that reviews the plumbing – the low-level interface that allows you to explore rich customization options, plus the full range of hover label extensions.