cancel
Showing results for 
Show  only  | Search instead for 
Did you mean: 
Browse apps to extend the software in the new JMP Marketplace
%3CLINGO-SUB%20id%3D%22lingo-sub-211949%22%20slang%3D%22en-US%22%20mode%3D%22NONE%22%20mode%3D%22NONE%22%20mode%3D%22NONE%22%3EGenetic%20Association%20with%20JMP%20Genomics%2C%20Part%204%3A%20Basic%20Linkage%20Mapping%3C%2FLINGO-SUB%3E%3CLINGO-BODY%20id%3D%22lingo-body-211949%22%20slang%3D%22en-US%22%20mode%3D%22NONE%22%20mode%3D%22NONE%22%20mode%3D%22NONE%22%3E%3CP%3EThe%20Basic%20Linkage%20Mapping%20Workflow%20in%20%3CA%20href%3D%22https%3A%2F%2Fwww.jmp.com%2Fen_us%2Fsoftware%2Fgenomics-data-analysis-software.html%3Futm_campaign%3Dtd7011O000002OuZY%26amp%3Butm_source%3Djmpercable%26amp%3Butm_medium%3Dsocial%22%20target%3D%22_blank%22%20rel%3D%22noopener%20noreferrer%22%3EJMP%20Genomics%3C%2FA%3E%20creates%20linkage%20maps%20using%20genetic%20marker%20data.%20The%20workflow%20includes%20output%20from%20the%20%3CSTRONG%3ERecombination%20and%20Linkage%20Groups%2C%20Linkage%20Map%20Order%2C%20%3C%2FSTRONG%3Eand%20%3CSTRONG%3ELinkage%20Map%20Viewer%3C%2FSTRONG%3E.%20This%20includes%20calculation%20of%20recombination%20frequencies%2C%20testing%20for%20segregation%20distortion%2C%20assigning%20linkage%20groups%20to%20sets%20of%20markers%2C%20generating%20visualized%20linkage%20maps%2C%20and%20reordering%20the%20data%20according%20to%20the%20linkage%20map%20for%20QTL%20analysis.%20This%20example%20will%20use%20oat%20data%20with%20around%20450%20genetic%20markers%20from%2090%20recombinant%20inbred%20oat%20lines.%3C%2FP%3E%0A%3COL%3E%0A%3CLI%3EFrom%20the%20%3CSTRONG%3EGenomics%20Starter%20%3C%2FSTRONG%3Ewindow%2C%20select%20%3CSTRONG%3EWorkflows%20%26gt%3B%20Basic%20%26gt%3B%20Basic%20Linkage%20Mapping%20Workflow%3C%2FSTRONG%3E%20to%20open%20the%20dialogue%20box.%3C%2FLI%3E%0A%3CLI%3EIn%20the%20%3CSTRONG%3EGeneral%20%3C%2FSTRONG%3Etab%2C%20select%20%3CSTRONG%3Epo_ingenotypes.%3C%2FSTRONG%3E%3CSTRONG%3Esas7bdat%3C%2FSTRONG%3E%20as%20the%20%3CSTRONG%3EInput%20Genotype%20SAS%20Data%20Set%3C%2FSTRONG%3E.%3CUL%3E%0A%3CLI%3EInspect%20the%20data%2C%20each%20marker%20is%20a%20column%2C%20starting%20on%20column%2010.%20Note%20that%20the%20genotypes%20are%20numerically%20coded%20with%200%20representing%20a%20homozygous%20genotype%20for%20the%20major%20allele%20and%202%20representing%20a%20homozygous%20genotype%20for%20the%20minor%20allele.%20For%20more%20information%20on%20numerically%20coded%20genotypes%20see%20%3CEM%3E%3CEM%3E%3CA%20href%3D%22http%3A%2F%2Fcommunity.jmp.com%2Ft5%2Fx%2Fx%2Fm-p%2F205410%22%20target%3D%22_blank%22%3EGenetic%20Association%20with%20JMP%20Genomics%2C%20Part%201%3A%20Importing%20and%20Cleaning%20Data%3C%2FA%3E%3CSPAN%20class%3D%22lia-inline-image-display-wrapper%20lia-image-align-center%22%20image-alt%3D%221_LM_geno_data.png%22%20style%3D%22width%3A%20746px%3B%22%3E%3CSPAN%20class%3D%22lia-inline-image-display-wrapper%22%20image-alt%3D%221_LM_geno_data.png%22%20style%3D%22width%3A%20746px%3B%22%3E%3CSPAN%20class%3D%22lia-inline-image-display-wrapper%22%20image-alt%3D%221_LM_geno_data.png%22%20style%3D%22width%3A%20746px%3B%22%3E%3CSPAN%20class%3D%22lia-inline-image-display-wrapper%22%20image-alt%3D%221_LM_geno_data.png%22%20style%3D%22width%3A%20746px%3B%22%3E%3Cspan%20class%3D%22lia-inline-image-display-wrapper%22%20image-alt%3D%221_LM_geno_data.png%22%20style%3D%22width%3A%20746px%3B%22%3E%3Cimg%20src%3D%22https%3A%2F%2Fcommunity.jmp.com%2Ft5%2Fimage%2Fserverpage%2Fimage-id%2F17585i3B3A6E1B683F0374%2Fimage-dimensions%2F746x288%3Fv%3Dv2%22%20width%3D%22746%22%20height%3D%22288%22%20role%3D%22button%22%20title%3D%221_LM_geno_data.png%22%20alt%3D%221_LM_geno_data.png%22%20%2F%3E%3C%2Fspan%3E%3C%2FSPAN%3E%3C%2FSPAN%3E%3C%2FSPAN%3E%3C%2FSPAN%3E%3C%2FEM%3E%3C%2FEM%3E%3CP%3E%26nbsp%3B%3C%2FP%3E%0A%3C%2FLI%3E%0A%3C%2FUL%3E%0A%3C%2FLI%3E%0A%3CLI%3EType%20%E2%80%9CGMI%3A%E2%80%9D%20into%20the%20%3CSTRONG%3EList-Style%20Specification%20of%20Marker%20Variables%20%3C%2FSTRONG%3Efield%20to%20specify%20every%20variable%20beginning%20with%20%E2%80%9CGMI%E2%80%9D%20as%20a%20marker%20variable.%3C%2FLI%3E%0A%3CLI%3ESelect%20an%20%3CSTRONG%3EOutput%20Folder%3C%2FSTRONG%3E.%3CSPAN%20class%3D%22lia-inline-image-display-wrapper%20lia-image-align-center%22%20image-alt%3D%222_LM_general.png%22%20style%3D%22width%3A%20609px%3B%22%3E%3CSPAN%20class%3D%22lia-inline-image-display-wrapper%22%20image-alt%3D%222_LM_general.png%22%20style%3D%22width%3A%20609px%3B%22%3E%3CSPAN%20class%3D%22lia-inline-image-display-wrapper%22%20image-alt%3D%222_LM_general.png%22%20style%3D%22width%3A%20609px%3B%22%3E%3CSPAN%20class%3D%22lia-inline-image-display-wrapper%22%20image-alt%3D%222_LM_general.png%22%20style%3D%22width%3A%20609px%3B%22%3E%3Cspan%20class%3D%22lia-inline-image-display-wrapper%22%20image-alt%3D%222_LM_general.png%22%20style%3D%22width%3A%20609px%3B%22%3E%3Cimg%20src%3D%22https%3A%2F%2Fcommunity.jmp.com%2Ft5%2Fimage%2Fserverpage%2Fimage-id%2F17588i107D72894731F841%2Fimage-size%2Flarge%3Fv%3Dv2%26amp%3Bpx%3D999%22%20role%3D%22button%22%20title%3D%222_LM_general.png%22%20alt%3D%222_LM_general.png%22%20%2F%3E%3C%2Fspan%3E%3C%2FSPAN%3E%3C%2FSPAN%3E%3C%2FSPAN%3E%3C%2FSPAN%3E%3C%2FLI%3E%0A%3CLI%3EIn%20the%20%3CSTRONG%3EOptions%20%3C%2FSTRONG%3Etab%2C%20select%20%3CEM%3ENumeric%20Genotypes%20%3C%2FEM%3Eas%20the%20%3CSTRONG%3EFormat%20of%20Marker%20Variables%3C%2FSTRONG%3E.%3CSPAN%20class%3D%22lia-inline-image-display-wrapper%20lia-image-align-center%22%20image-alt%3D%223_LM_Options.png%22%20style%3D%22width%3A%20609px%3B%22%3E%3CSPAN%20class%3D%22lia-inline-image-display-wrapper%22%20image-alt%3D%223_LM_Options.png%22%20style%3D%22width%3A%20609px%3B%22%3E%3CSPAN%20class%3D%22lia-inline-image-display-wrapper%22%20image-alt%3D%223_LM_Options.png%22%20style%3D%22width%3A%20609px%3B%22%3E%3CSPAN%20class%3D%22lia-inline-image-display-wrapper%22%20image-alt%3D%223_LM_Options.png%22%20style%3D%22width%3A%20609px%3B%22%3E%3Cspan%20class%3D%22lia-inline-image-display-wrapper%22%20image-alt%3D%223_LM_Options.png%22%20style%3D%22width%3A%20609px%3B%22%3E%3Cimg%20src%3D%22https%3A%2F%2Fcommunity.jmp.com%2Ft5%2Fimage%2Fserverpage%2Fimage-id%2F17589i2105A3640B418880%2Fimage-size%2Flarge%3Fv%3Dv2%26amp%3Bpx%3D999%22%20role%3D%22button%22%20title%3D%223_LM_Options.png%22%20alt%3D%223_LM_Options.png%22%20%2F%3E%3C%2Fspan%3E%3C%2FSPAN%3E%3C%2FSPAN%3E%3C%2FSPAN%3E%3C%2FSPAN%3E%3C%2FLI%3E%0A%3CLI%3EThe%20%3CSTRONG%3EAnnotation%20%3C%2FSTRONG%3Etab%20does%20not%20require%20input%20in%20this%20example%20and%20is%20always%20optional.%20For%20data%20with%20separate%20annotation%20data%20sets%2C%20they%20can%20be%20entered%20here.%3C%2FLI%3E%0A%3CLI%3EThe%20%3CSTRONG%3EFramework%20Map%20%3C%2FSTRONG%3Etab%20is%20also%20optional.%20This%20tab%20is%20used%20if%20there%20are%20pre-defined%20linkage%20groups%20for%20a%20set%20of%20markers.%20In%20this%20case%2C%20enter%20%3CSTRONG%3Eoat_framework.%3C%2FSTRONG%3E%3CSTRONG%3Esas7bdat%20%3C%2FSTRONG%3Eas%20the%20%3CSTRONG%3EFramework%20Map%20Data%20Set%3C%2FSTRONG%3E.%3CUL%3E%0A%3CLI%3EOpen%20the%20data%20set%20and%20notice%20that%20172%20of%20the%20markers%20are%20already%20sorted%20into%2022%20known%20framework%20groups.%20Each%20marker%20is%20ordered%20within%20its%20corresponding%20framework%20group.%3CSPAN%20class%3D%22lia-inline-image-display-wrapper%20lia-image-align-center%22%20image-alt%3D%224_LM_framework_data.png%22%20style%3D%22width%3A%20749px%3B%22%3E%3CSPAN%20class%3D%22lia-inline-image-display-wrapper%22%20image-alt%3D%224_LM_framework_data.png%22%20style%3D%22width%3A%20749px%3B%22%3E%3CSPAN%20class%3D%22lia-inline-image-display-wrapper%22%20image-alt%3D%224_LM_framework_data.png%22%20style%3D%22width%3A%20749px%3B%22%3E%3CSPAN%20class%3D%22lia-inline-image-display-wrapper%22%20image-alt%3D%224_LM_framework_data.png%22%20style%3D%22width%3A%20749px%3B%22%3E%3Cspan%20class%3D%22lia-inline-image-display-wrapper%22%20image-alt%3D%224_LM_framework_data.png%22%20style%3D%22width%3A%20749px%3B%22%3E%3Cimg%20src%3D%22https%3A%2F%2Fcommunity.jmp.com%2Ft5%2Fimage%2Fserverpage%2Fimage-id%2F17590iCFD2AAF436BE1D26%2Fimage-dimensions%2F749x500%3Fv%3Dv2%22%20width%3D%22749%22%20height%3D%22500%22%20role%3D%22button%22%20title%3D%224_LM_framework_data.png%22%20alt%3D%224_LM_framework_data.png%22%20%2F%3E%3C%2Fspan%3E%3C%2FSPAN%3E%3C%2FSPAN%3E%3C%2FSPAN%3E%3C%2FSPAN%3E%3C%2FLI%3E%0A%3C%2FUL%3E%0A%3C%2FLI%3E%0A%3CLI%3ESelect%20%3CEM%3EMarker%20%3C%2FEM%3Eas%20the%20%3CSTRONG%3EFramework%20Marker%20Name%20Variable%3C%2FSTRONG%3E%2C%20%3CEM%3EFramework_Groups%20%3C%2FEM%3Eas%20the%20%3CSTRONG%3EFramework%20Linkage%20Group%20Variable%3C%2FSTRONG%3E%2C%20and%20%3CEM%3EFramework_Order%20%3C%2FEM%3Eas%20the%20%3CSTRONG%3EFramework%20Order%20Variable%3C%2FSTRONG%3E.%3CSPAN%20class%3D%22lia-inline-image-display-wrapper%20lia-image-align-center%22%20image-alt%3D%225_LM_FrameMap.png%22%20style%3D%22width%3A%20609px%3B%22%3E%3CSPAN%20class%3D%22lia-inline-image-display-wrapper%22%20image-alt%3D%225_LM_FrameMap.png%22%20style%3D%22width%3A%20609px%3B%22%3E%3CSPAN%20class%3D%22lia-inline-image-display-wrapper%22%20image-alt%3D%225_LM_FrameMap.png%22%20style%3D%22width%3A%20609px%3B%22%3E%3CSPAN%20class%3D%22lia-inline-image-display-wrapper%22%20image-alt%3D%225_LM_FrameMap.png%22%20style%3D%22width%3A%20609px%3B%22%3E%3Cspan%20class%3D%22lia-inline-image-display-wrapper%22%20image-alt%3D%225_LM_FrameMap.png%22%20style%3D%22width%3A%20609px%3B%22%3E%3Cimg%20src%3D%22https%3A%2F%2Fcommunity.jmp.com%2Ft5%2Fimage%2Fserverpage%2Fimage-id%2F17591i7C71DB7435C2E64D%2Fimage-size%2Flarge%3Fv%3Dv2%26amp%3Bpx%3D999%22%20role%3D%22button%22%20title%3D%225_LM_FrameMap.png%22%20alt%3D%225_LM_FrameMap.png%22%20%2F%3E%3C%2Fspan%3E%3C%2FSPAN%3E%3C%2FSPAN%3E%3C%2FSPAN%3E%3C%2FSPAN%3E%3C%2FLI%3E%0A%3CLI%3EIn%20the%20%3CSTRONG%3ELinkage%20Groups%20%3C%2FSTRONG%3Etab%2C%20Select%20%3CEM%3EIRILself%20%3C%2FEM%3Eas%20the%20%3CSTRONG%3ECross%20Type%3C%2FSTRONG%3E.%3CUL%3E%0A%3CLI%3EThis%20experimental%20population%20is%20an%20intercrossed%20recombinant%20inbred%20line.%20A%20list%20of%20cross%20types%20and%20their%20descriptions%20is%20shown%20in%20the%20table%20below.%3CSPAN%20class%3D%22lia-inline-image-display-wrapper%20lia-image-align-center%22%20image-alt%3D%226_LM_Cross_Types.png%22%20style%3D%22width%3A%20748px%3B%22%3E%3CSPAN%20class%3D%22lia-inline-image-display-wrapper%22%20image-alt%3D%226_LM_Cross_Types.png%22%20style%3D%22width%3A%20748px%3B%22%3E%3CSPAN%20class%3D%22lia-inline-image-display-wrapper%22%20image-alt%3D%226_LM_Cross_Types.png%22%20style%3D%22width%3A%20748px%3B%22%3E%3CSPAN%20class%3D%22lia-inline-image-display-wrapper%22%20image-alt%3D%226_LM_Cross_Types.png%22%20style%3D%22width%3A%20748px%3B%22%3E%3Cspan%20class%3D%22lia-inline-image-display-wrapper%22%20image-alt%3D%226_LM_Cross_Types.png%22%20style%3D%22width%3A%20748px%3B%22%3E%3Cimg%20src%3D%22https%3A%2F%2Fcommunity.jmp.com%2Ft5%2Fimage%2Fserverpage%2Fimage-id%2F17592iB4E2344D796E4BA7%2Fimage-dimensions%2F748x482%3Fv%3Dv2%22%20width%3D%22748%22%20height%3D%22482%22%20role%3D%22button%22%20title%3D%226_LM_Cross_Types.png%22%20alt%3D%226_LM_Cross_Types.png%22%20%2F%3E%3C%2Fspan%3E%3C%2FSPAN%3E%3C%2FSPAN%3E%3C%2FSPAN%3E%3C%2FSPAN%3E%3C%2FLI%3E%0A%3C%2FUL%3E%0A%3C%2FLI%3E%0A%3CLI%3EFor%20the%20number%20of%20%3CSTRONG%3ERandom%20Mating%20Generations%20Prior%20to%20Inbreeding%3C%2FSTRONG%3E%2C%20enter%20%3CEM%3E2%3C%2FEM%3E.%20This%20is%20the%20number%20of%20generations%20of%20random%20mating%20that%20occurred%20between%20the%20initial%20cross%20and%20the%20start%20of%20inbreeding.%3C%2FLI%3E%0A%3CLI%3EIf%20the%20experimental%20cross%20has%20unique%20expected%20segregation%20ratios%2C%20they%20can%20be%20specified%20in%20the%20%3CSTRONG%3EExpected%20Segregation%20Ratios%20%3C%2FSTRONG%3E%20The%20expected%20ratios%20for%20an%20RIL%20self%20cross%20like%20the%20one%20in%20this%20population%20is%200.5%20%3A%200%20%3A%200.5%26nbsp%3B%20--%20which%20is%20the%20default%20if%20no%20other%20values%20are%20entered.%3C%2FLI%3E%0A%3CLI%3ESelect%20%3CEM%3EFDR%20%3C%2FEM%3Eas%20the%20%3CSTRONG%3EMultiple%20Testing%20Method%20for%20Segregation%20Tests%3C%2FSTRONG%3E.%20This%20minimizes%20the%20False%20Discovery%20Rate.%3C%2FLI%3E%0A%3CLI%3ESet%20the%20%3CSTRONG%3EGrouping%20Recombination%20Fraction%20Threshold%20%3C%2FSTRONG%3Eto%20%3CEM%3E25%3C%2FEM%3E.%20This%20will%20be%20the%20maximum%20recombination%20fraction%20for%20assigning%20a%20marker%20to%20a%20linkage%20group.%20The%20lower%20this%20number%2C%20the%20greater%20amount%20of%20linkage%20that%20needs%20to%20occur%20for%20markers%20to%20be%20placed%20within%20the%20same%20group.%3CSPAN%20class%3D%22lia-inline-image-display-wrapper%20lia-image-align-center%22%20image-alt%3D%227_LM_LinkGroup.png%22%20style%3D%22width%3A%20609px%3B%22%3E%3CSPAN%20class%3D%22lia-inline-image-display-wrapper%22%20image-alt%3D%227_LM_LinkGroup.png%22%20style%3D%22width%3A%20609px%3B%22%3E%3CSPAN%20class%3D%22lia-inline-image-display-wrapper%22%20image-alt%3D%227_LM_LinkGroup.png%22%20style%3D%22width%3A%20609px%3B%22%3E%3CSPAN%20class%3D%22lia-inline-image-display-wrapper%22%20image-alt%3D%227_LM_LinkGroup.png%22%20style%3D%22width%3A%20609px%3B%22%3E%3Cspan%20class%3D%22lia-inline-image-display-wrapper%22%20image-alt%3D%227_LM_LinkGroup.png%22%20style%3D%22width%3A%20609px%3B%22%3E%3Cimg%20src%3D%22https%3A%2F%2Fcommunity.jmp.com%2Ft5%2Fimage%2Fserverpage%2Fimage-id%2F17593iA7EF81F9B224E34A%2Fimage-size%2Flarge%3Fv%3Dv2%26amp%3Bpx%3D999%22%20role%3D%22button%22%20title%3D%227_LM_LinkGroup.png%22%20alt%3D%227_LM_LinkGroup.png%22%20%2F%3E%3C%2Fspan%3E%3C%2FSPAN%3E%3C%2FSPAN%3E%3C%2FSPAN%3E%3C%2FSPAN%3E%3C%2FLI%3E%0A%3CLI%3EOn%20the%20%3CSTRONG%3ELinkage%20Map%20Order%20%3C%2FSTRONG%3Etab%2C%20select%20%3CEM%3EHaldane%20%3C%2FEM%3Eas%20the%20%3CSTRONG%3EMap%20Function%3C%2FSTRONG%3E.%20These%20are%20different%20methods%20for%20converting%20recombination%20fractions%20into%20distance%20in%20centimorgans%20(cM).%3C%2FLI%3E%0A%3CLI%3ECheck%20the%20box%20to%20%3CSTRONG%3EBreak%20linkage%20groups%20between%20markers%20with%20large%20ordered%20distances%3C%2FSTRONG%3E.%20Break%20the%20groups%20up%20by%20%3CEM%3EGenetic%20Distance%20%3C%2FEM%3Eand%20set%20that%20%3CSTRONG%3EGenetic%20Distance%20Break%20Value%20%3C%2FSTRONG%3Eto%20%3CEM%3E40%3C%2FEM%3E.%20This%20means%20that%20if%20the%20distance%20between%20two%20markers%20in%20a%20linkage%20group%20exceeds%2040%2C%20that%20group%20will%20be%20broken%20into%20more%20than%20one%20linkage%20group.%3C%2FLI%3E%0A%3CLI%3EDeselect%20the%20box%20next%20to%20%3CSTRONG%3EDisplay%20marker%20genotype%20cell%20color%20plots%3C%2FSTRONG%3E.%20This%20creates%20cell%20plots%20with%20each%20genotype%20represented%20for%20every%20marker.%20It%20is%20not%20necessary%20here%20and%20increases%20computing%20time.%3C%2FLI%3E%0A%3CLI%3ECheck%20the%20box%20next%20to%20%3CSTRONG%3ERun%20Subset%20and%20Reorder%20Genetic%20Data%20process%20to%20order%20marker%20data%20for%20QTL%20analysis%3C%2FSTRONG%3E%20to%20reorder%20the%20data%20according%20to%20its%20linkage%20groups.%3CUL%3E%0A%3CLI%3EThe%20resulting%20data%20set%20will%20be%20handy%20later%20in%20performing%20%3CA%20href%3D%22http%3A%2F%2Fcommunity.jmp.com%2Ft5%2Fx%2Fx%2Fm-p%2F211995%22%20target%3D%22_blank%22%3EQTL%20Analysis%3C%2FA%3E.%3CSPAN%20class%3D%22lia-inline-image-display-wrapper%20lia-image-align-center%22%20image-alt%3D%228_LM_LinkMapOrder.png%22%20style%3D%22width%3A%20750px%3B%22%3E%3CSPAN%20class%3D%22lia-inline-image-display-wrapper%22%20image-alt%3D%228_LM_LinkMapOrder.png%22%20style%3D%22width%3A%20750px%3B%22%3E%3CSPAN%20class%3D%22lia-inline-image-display-wrapper%22%20image-alt%3D%228_LM_LinkMapOrder.png%22%20style%3D%22width%3A%20750px%3B%22%3E%3CSPAN%20class%3D%22lia-inline-image-display-wrapper%22%20image-alt%3D%228_LM_LinkMapOrder.png%22%20style%3D%22width%3A%20750px%3B%22%3E%3Cspan%20class%3D%22lia-inline-image-display-wrapper%22%20image-alt%3D%228_LM_LinkMapOrder.png%22%20style%3D%22width%3A%20750px%3B%22%3E%3Cimg%20src%3D%22https%3A%2F%2Fcommunity.jmp.com%2Ft5%2Fimage%2Fserverpage%2Fimage-id%2F17594iF8A57EF8BC0C0481%2Fimage-dimensions%2F750x751%3Fv%3Dv2%22%20width%3D%22750%22%20height%3D%22751%22%20role%3D%22button%22%20title%3D%228_LM_LinkMapOrder.png%22%20alt%3D%228_LM_LinkMapOrder.png%22%20%2F%3E%3C%2Fspan%3E%3C%2FSPAN%3E%3C%2FSPAN%3E%3C%2FSPAN%3E%3C%2FSPAN%3E%3C%2FLI%3E%0A%3C%2FUL%3E%0A%3C%2FLI%3E%0A%3CLI%3EThe%20%3CSTRONG%3ELinkage%20Map%20Viewer%20%3C%2FSTRONG%3Etab%20allows%20for%20changes%20in%20the%20color%20scheme%20and%20output%20layout%20for%20the%203D%20chromosome%20linkage%20maps.%20Leave%20the%20default%20options%20here.%3C%2FLI%3E%0A%3CLI%3ESelect%20%3CSTRONG%3ERun%20%3C%2FSTRONG%3Eto%20begin%20the%20analysis.%20When%20the%20analysis%20is%20finished%20running%2C%20the%20following%20%3CSTRONG%3EJMP%20Journal%20%3C%2FSTRONG%3Ewill%20appear.%3CSPAN%20class%3D%22lia-inline-image-display-wrapper%20lia-image-align-center%22%20image-alt%3D%22LM_Journal.png%22%20style%3D%22width%3A%20271px%3B%22%3E%3CSPAN%20class%3D%22lia-inline-image-display-wrapper%22%20image-alt%3D%22LM_Journal.png%22%20style%3D%22width%3A%20271px%3B%22%3E%3CSPAN%20class%3D%22lia-inline-image-display-wrapper%22%20image-alt%3D%22LM_Journal.png%22%20style%3D%22width%3A%20271px%3B%22%3E%3CSPAN%20class%3D%22lia-inline-image-display-wrapper%22%20image-alt%3D%22LM_Journal.png%22%20style%3D%22width%3A%20271px%3B%22%3E%3Cspan%20class%3D%22lia-inline-image-display-wrapper%22%20image-alt%3D%22LM_Journal.png%22%20style%3D%22width%3A%20271px%3B%22%3E%3Cimg%20src%3D%22https%3A%2F%2Fcommunity.jmp.com%2Ft5%2Fimage%2Fserverpage%2Fimage-id%2F17595i2B243F016685CE58%2Fimage-size%2Flarge%3Fv%3Dv2%26amp%3Bpx%3D999%22%20role%3D%22button%22%20title%3D%22LM_Journal.png%22%20alt%3D%22LM_Journal.png%22%20%2F%3E%3C%2Fspan%3E%3C%2FSPAN%3E%3C%2FSPAN%3E%3C%2FSPAN%3E%3C%2FSPAN%3E%3C%2FLI%3E%0A%3C%2FOL%3E%0A%3CH3%20id%3D%22toc-hId-1449029739%22%20id%3D%22toc-hId-1449029894%22%20id%3D%22toc-hId-1449029894%22%20id%3D%22toc-hId-1449029894%22%20id%3D%22toc-hId-1449029894%22%3EResults%3C%2FH3%3E%0A%3COL%20start%3D%2220%22%3E%0A%3CLI%3EClick%20the%20first%20results%20button%2C%20%3CSTRONG%3ERecombination%20and%20Linkage%20Groups%3C%2FSTRONG%3E.%3C%2FLI%3E%0A%3CLI%3EThe%20first%20output%20to%20appear%20is%20the%20heatmap%20of%20the%20%3CSTRONG%3ELinkage%20Group%20Results%3C%2FSTRONG%3E.%20Red%20blocks%20in%20the%20heatmap%20represent%20very%20low%20recombination%20frequencies%20and%20thus%20highly%20linked%20markers.%20Each%20linkage%20group%20(27)%20is%20listed%20to%20the%20right%20of%20the%20window%20under%20%3CSTRONG%3ELGroup%20%3C%2FSTRONG%3Ewith%20the%20number%20of%20markers%20in%20each%20group%20shown%20in%20parentheses.%20Click%20on%20any%20of%20the%20linkage%20groups%20in%20this%20list%20to%20display%20a%20heatmap%20for%20only%20that%20group.%3C%2FLI%3E%0A%3CLI%3EThe%20dotplot%20to%20the%20left%20of%20the%20heatmap%20represents%20genotype%20frequencies.%20When%20the%20dots%20are%20closer%20together%20a%20homozygous%20major%20genotype%20is%20more%20frequent%2C%20and%20when%20the%20dots%20are%20far%20apart%20a%20homozygous%20minor%20genotype%20is%20more%20frequent.%3CSPAN%20class%3D%22lia-inline-image-display-wrapper%20lia-image-align-center%22%20image-alt%3D%229_Heatmap.png%22%20style%3D%22width%3A%20747px%3B%22%3E%3CSPAN%20class%3D%22lia-inline-image-display-wrapper%22%20image-alt%3D%229_Heatmap.png%22%20style%3D%22width%3A%20747px%3B%22%3E%3CSPAN%20class%3D%22lia-inline-image-display-wrapper%22%20image-alt%3D%229_Heatmap.png%22%20style%3D%22width%3A%20747px%3B%22%3E%3CSPAN%20class%3D%22lia-inline-image-display-wrapper%22%20image-alt%3D%229_Heatmap.png%22%20style%3D%22width%3A%20747px%3B%22%3E%3Cspan%20class%3D%22lia-inline-image-display-wrapper%22%20image-alt%3D%229_Heatmap.png%22%20style%3D%22width%3A%20747px%3B%22%3E%3Cimg%20src%3D%22https%3A%2F%2Fcommunity.jmp.com%2Ft5%2Fimage%2Fserverpage%2Fimage-id%2F17596iC4A3C31644F8D37E%2Fimage-dimensions%2F747x400%3Fv%3Dv2%22%20width%3D%22747%22%20height%3D%22400%22%20role%3D%22button%22%20title%3D%229_Heatmap.png%22%20alt%3D%229_Heatmap.png%22%20%2F%3E%3C%2Fspan%3E%3C%2FSPAN%3E%3C%2FSPAN%3E%3C%2FSPAN%3E%3C%2FSPAN%3E%3C%2FLI%3E%0A%3CLI%3EThe%20%3CSTRONG%3ESegregation%20and%20Linkage%20Groups%20%3C%2FSTRONG%3Etab%20shows%20a%20plot%20of%20the%20segregation%20ratios%20for%20each%20of%20the%20linkage%20groups%20(created%20using%20recombination%20frequencies)%20and%20framework%20groups%20(specified%20in%20the%20framework%20map%20data%20set).%20The%20linkage%20groups%20are%20represented%20on%20the%20plot%20with%20dots%2C%20and%20the%20framework%20groups%20with%20stars.%20Note%20that%20many%20of%20these%20groups%20coincide%20with%20one%20another.%20The%20dotted%20red%20line%20represents%20statistical%20significance%20for%20the%20points%20found%20above%20it.%20Click%20any%20of%20the%20framework%20or%20linkage%20groups%20to%20highlight%20them%20in%20the%20plot.%3CSPAN%20class%3D%22lia-inline-image-display-wrapper%20lia-image-align-center%22%20image-alt%3D%2210_LinkGroup_Seg.png%22%20style%3D%22width%3A%20749px%3B%22%3E%3CSPAN%20class%3D%22lia-inline-image-display-wrapper%22%20image-alt%3D%2210_LinkGroup_Seg.png%22%20style%3D%22width%3A%20749px%3B%22%3E%3CSPAN%20class%3D%22lia-inline-image-display-wrapper%22%20image-alt%3D%2210_LinkGroup_Seg.png%22%20style%3D%22width%3A%20749px%3B%22%3E%3CSPAN%20class%3D%22lia-inline-image-display-wrapper%22%20image-alt%3D%2210_LinkGroup_Seg.png%22%20style%3D%22width%3A%20749px%3B%22%3E%3Cspan%20class%3D%22lia-inline-image-display-wrapper%22%20image-alt%3D%2210_LinkGroup_Seg.png%22%20style%3D%22width%3A%20749px%3B%22%3E%3Cimg%20src%3D%22https%3A%2F%2Fcommunity.jmp.com%2Ft5%2Fimage%2Fserverpage%2Fimage-id%2F17597iC73950F1E89964DC%2Fimage-dimensions%2F749x401%3Fv%3Dv2%22%20width%3D%22749%22%20height%3D%22401%22%20role%3D%22button%22%20title%3D%2210_LinkGroup_Seg.png%22%20alt%3D%2210_LinkGroup_Seg.png%22%20%2F%3E%3C%2Fspan%3E%3C%2FSPAN%3E%3C%2FSPAN%3E%3C%2FSPAN%3E%3C%2FSPAN%3E%3C%2FLI%3E%0A%3CLI%3EReturn%20to%20the%20%3CSTRONG%3EJMP%20Journal%20%3C%2FSTRONG%3Eand%20select%20%3CSTRONG%3ELinkage%20Map%20Order%3C%2FSTRONG%3E.%20The%20resulting%20output%20is%20a%20plot%20of%20the%20genetic%20distances%20in%20cM%20of%20the%20markers%20in%20each%20linkage%20group.%20The%20markers%20are%20colored%20according%20to%20their%20original%20framework%20group%2C%20and%20the%20x-axis%20has%20each%20linkage%20group.%20There%20are%20now%2037%20linkage%20groups%20as%20opposed%20to%20the%20original%20framework%20map.%20This%20is%20due%20to%20the%20splitting%20of%20groups%20with%20markers%20greater%20than%2040%20cM%20apart.%3CSPAN%20class%3D%22lia-inline-image-display-wrapper%20lia-image-align-center%22%20image-alt%3D%2211_LinkMapOrder.png%22%20style%3D%22width%3A%20749px%3B%22%3E%3CSPAN%20class%3D%22lia-inline-image-display-wrapper%22%20image-alt%3D%2211_LinkMapOrder.png%22%20style%3D%22width%3A%20749px%3B%22%3E%3CSPAN%20class%3D%22lia-inline-image-display-wrapper%22%20image-alt%3D%2211_LinkMapOrder.png%22%20style%3D%22width%3A%20749px%3B%22%3E%3CSPAN%20class%3D%22lia-inline-image-display-wrapper%22%20image-alt%3D%2211_LinkMapOrder.png%22%20style%3D%22width%3A%20749px%3B%22%3E%3Cspan%20class%3D%22lia-inline-image-display-wrapper%22%20image-alt%3D%2211_LinkMapOrder.png%22%20style%3D%22width%3A%20749px%3B%22%3E%3Cimg%20src%3D%22https%3A%2F%2Fcommunity.jmp.com%2Ft5%2Fimage%2Fserverpage%2Fimage-id%2F17598iC26ECA8A8FD398C5%2Fimage-dimensions%2F749x433%3Fv%3Dv2%22%20width%3D%22749%22%20height%3D%22433%22%20role%3D%22button%22%20title%3D%2211_LinkMapOrder.png%22%20alt%3D%2211_LinkMapOrder.png%22%20%2F%3E%3C%2Fspan%3E%3C%2FSPAN%3E%3C%2FSPAN%3E%3C%2FSPAN%3E%3C%2FSPAN%3E%3C%2FLI%3E%0A%3CLI%3EIn%20the%20%3CSTRONG%3EDrill%20Downs%20%3C%2FSTRONG%3Emenu%20on%20the%20left%20of%20the%20output%20window%2C%20each%20of%20the%20individual%20linkage%20groups%20can%20be%20selected%20for%20further%20inspection.%20Select%20%3CSTRONG%3ELinkage%20Group%2017%3C%2FSTRONG%3E.%20New%20windows%20will%20open%20showing%20a%20heatmap%20of%20each%20marker%20in%20that%20linkage%20group%20and%20its%20recombination%20frequency%20as%20well%20as%20a%20dataset%20with%20the%20recombination%20frequencies%20between%20each%20marker%20in%20the%20group.%20Each%20marker%E2%80%99s%20place%20in%20the%20linkage%20group%20can%20be%20seen%20on%20the%20horizontal%20linkage%20map%20above%20the%20heatmap.%3CSPAN%20class%3D%22lia-inline-image-display-wrapper%20lia-image-align-center%22%20image-alt%3D%2212a_recombPlot_LGroup17_data.png%22%20style%3D%22width%3A%20750px%3B%22%3E%3CSPAN%20class%3D%22lia-inline-image-display-wrapper%22%20image-alt%3D%2212a_recombPlot_LGroup17_data.png%22%20style%3D%22width%3A%20750px%3B%22%3E%3CSPAN%20class%3D%22lia-inline-image-display-wrapper%22%20image-alt%3D%2212a_recombPlot_LGroup17_data.png%22%20style%3D%22width%3A%20750px%3B%22%3E%3CSPAN%20class%3D%22lia-inline-image-display-wrapper%22%20image-alt%3D%2212a_recombPlot_LGroup17_data.png%22%20style%3D%22width%3A%20750px%3B%22%3E%3Cspan%20class%3D%22lia-inline-image-display-wrapper%22%20image-alt%3D%2212a_recombPlot_LGroup17_data.png%22%20style%3D%22width%3A%20750px%3B%22%3E%3Cimg%20src%3D%22https%3A%2F%2Fcommunity.jmp.com%2Ft5%2Fimage%2Fserverpage%2Fimage-id%2F17599iFA7B3ABFA4B35379%2Fimage-dimensions%2F750x495%3Fv%3Dv2%22%20width%3D%22750%22%20height%3D%22495%22%20role%3D%22button%22%20title%3D%2212a_recombPlot_LGroup17_data.png%22%20alt%3D%2212a_recombPlot_LGroup17_data.png%22%20%2F%3E%3C%2Fspan%3E%3C%2FSPAN%3E%3C%2FSPAN%3E%3C%2FSPAN%3E%3C%2FSPAN%3E%3CSPAN%20class%3D%22lia-inline-image-display-wrapper%20lia-image-align-center%22%20image-alt%3D%2212b_recombPlot_LGroup17.png%22%20style%3D%22width%3A%20750px%3B%22%3E%3CSPAN%20class%3D%22lia-inline-image-display-wrapper%22%20image-alt%3D%2212b_recombPlot_LGroup17.png%22%20style%3D%22width%3A%20750px%3B%22%3E%3CSPAN%20class%3D%22lia-inline-image-display-wrapper%22%20image-alt%3D%2212b_recombPlot_LGroup17.png%22%20style%3D%22width%3A%20750px%3B%22%3E%3CSPAN%20class%3D%22lia-inline-image-display-wrapper%22%20image-alt%3D%2212b_recombPlot_LGroup17.png%22%20style%3D%22width%3A%20750px%3B%22%3E%3Cspan%20class%3D%22lia-inline-image-display-wrapper%22%20image-alt%3D%2212b_recombPlot_LGroup17.png%22%20style%3D%22width%3A%20750px%3B%22%3E%3Cimg%20src%3D%22https%3A%2F%2Fcommunity.jmp.com%2Ft5%2Fimage%2Fserverpage%2Fimage-id%2F17600iBF179E88F54AD605%2Fimage-dimensions%2F750x569%3Fv%3Dv2%22%20width%3D%22750%22%20height%3D%22569%22%20role%3D%22button%22%20title%3D%2212b_recombPlot_LGroup17.png%22%20alt%3D%2212b_recombPlot_LGroup17.png%22%20%2F%3E%3C%2Fspan%3E%3C%2FSPAN%3E%3C%2FSPAN%3E%3C%2FSPAN%3E%3C%2FSPAN%3E%3C%2FLI%3E%0A%3C%2FOL%3E%0A%3CP%3E%26nbsp%3B%26nbsp%3B%26nbsp%3B%20%26nbsp%3B%26nbsp%3B%3C%2FP%3E%0A%3COL%20start%3D%2226%22%3E%0A%3CLI%3ENext%2C%20return%20to%20the%20%3CSTRONG%3EJMP%20Journal%20%3C%2FSTRONG%3Eand%20select%20the%20%3CSTRONG%3ELinkage%20Map%20Viewer%3C%2FSTRONG%3E.%20The%20%3CSTRONG%3E3D%20Linkage%20Map%20%3C%2FSTRONG%3Eoutput%20will%20appear%20in%20a%20new%20window.%20This%20output%20gives%20a%20visualization%20of%20each%20linkage%20group%2C%20with%20positions%20annotated%20on%20the%20left%20and%20marker%20names%20on%20the%20right.%20The%20sliders%20at%20the%20top%20of%20the%20window%20adjust%20the%20aesthetics%20of%20the%20maps.%20Below%20is%20the%20map%20of%20linkage%20group%202.%3CSPAN%20class%3D%22lia-inline-image-display-wrapper%20lia-image-align-center%22%20image-alt%3D%2213_LinkMap_3D_Chrom2.png%22%20style%3D%22width%3A%20291px%3B%22%3E%3CSPAN%20class%3D%22lia-inline-image-display-wrapper%22%20image-alt%3D%2213_LinkMap_3D_Chrom2.png%22%20style%3D%22width%3A%20291px%3B%22%3E%3CSPAN%20class%3D%22lia-inline-image-display-wrapper%22%20image-alt%3D%2213_LinkMap_3D_Chrom2.png%22%20style%3D%22width%3A%20291px%3B%22%3E%3CSPAN%20class%3D%22lia-inline-image-display-wrapper%22%20image-alt%3D%2213_LinkMap_3D_Chrom2.png%22%20style%3D%22width%3A%20291px%3B%22%3E%3Cspan%20class%3D%22lia-inline-image-display-wrapper%22%20image-alt%3D%2213_LinkMap_3D_Chrom2.png%22%20style%3D%22width%3A%20291px%3B%22%3E%3Cimg%20src%3D%22https%3A%2F%2Fcommunity.jmp.com%2Ft5%2Fimage%2Fserverpage%2Fimage-id%2F17601i87A295C73588C08F%2Fimage-size%2Flarge%3Fv%3Dv2%26amp%3Bpx%3D999%22%20role%3D%22button%22%20title%3D%2213_LinkMap_3D_Chrom2.png%22%20alt%3D%2213_LinkMap_3D_Chrom2.png%22%20%2F%3E%3C%2Fspan%3E%3C%2FSPAN%3E%3C%2FSPAN%3E%3C%2FSPAN%3E%3C%2FSPAN%3E%3C%2FLI%3E%0A%3CLI%3EThe%20last%20output%20from%20the%20%3CSTRONG%3EJMP%20Journal%20%3C%2FSTRONG%3Eis%20the%20%3CSTRONG%3ESubset%20and%20Reorder%20Genetic%20Data%2C%3C%2FSTRONG%3E%20which%20are%20both%20a%20genotype%20(%3CSTRONG%3Epo_ingenotypes.%3C%2FSTRONG%3E%3CSTRONG%3Esas7bdat%3C%2FSTRONG%3E)%20and%20an%20annotation%20(%3CSTRONG%3Epo_ingenotypes_lmo_sr.sas7bdat%3C%2FSTRONG%3E)%20data%20set%20that%20can%20be%20used%20for%20QTL%20analysis.%20These%20data%20sets%20will%20be%20saved%20to%20the%20%3CSTRONG%3EOutput%20Folder%20%3C%2FSTRONG%3Edesignated%20in%20the%20%3CSTRONG%3EGeneral%20%3C%2FSTRONG%3Etab.%20Below%20is%20the%20annotation%20set%20with%20453%20markers%20and%20linkage%20data%20for%20each.%3CSPAN%20class%3D%22lia-inline-image-display-wrapper%20lia-image-align-center%22%20image-alt%3D%2214output_subsetanno.png%22%20style%3D%22width%3A%20750px%3B%22%3E%3CSPAN%20class%3D%22lia-inline-image-display-wrapper%22%20image-alt%3D%2214output_subsetanno.png%22%20style%3D%22width%3A%20750px%3B%22%3E%3CSPAN%20class%3D%22lia-inline-image-display-wrapper%22%20image-alt%3D%2214output_subsetanno.png%22%20style%3D%22width%3A%20750px%3B%22%3E%3CSPAN%20class%3D%22lia-inline-image-display-wrapper%22%20image-alt%3D%2214output_subsetanno.png%22%20style%3D%22width%3A%20750px%3B%22%3E%3Cspan%20class%3D%22lia-inline-image-display-wrapper%22%20image-alt%3D%2214output_subsetanno.png%22%20style%3D%22width%3A%20750px%3B%22%3E%3Cimg%20src%3D%22https%3A%2F%2Fcommunity.jmp.com%2Ft5%2Fimage%2Fserverpage%2Fimage-id%2F17602i83D55E0108005F49%2Fimage-dimensions%2F750x340%3Fv%3Dv2%22%20width%3D%22750%22%20height%3D%22340%22%20role%3D%22button%22%20title%3D%2214output_subsetanno.png%22%20alt%3D%2214output_subsetanno.png%22%20%2F%3E%3C%2Fspan%3E%3C%2FSPAN%3E%3C%2FSPAN%3E%3C%2FSPAN%3E%3C%2FSPAN%3E%3C%2FLI%3E%0A%3C%2FOL%3E%0A%3CH1%20id%3D%22toc-hId--710100212%22%20id%3D%22toc-hId--710100057%22%20id%3D%22toc-hId--710100057%22%20id%3D%22toc-hId--710100057%22%20id%3D%22toc-hId--710100057%22%3E%3CFONT%20size%3D%223%22%3E*The%20interactive%20reports%20generated%20from%20this%20workflow%20can%20be%20viewed%20on%20%3CA%20href%3D%22https%3A%2F%2Fpublic.jmp.com%2Fpackages%2FJMP-Genomics-Linkage-Mapping-Workflow-Re%2Fjs-p%2F5cf95cb3b5dc1505e0d818c8%22%20target%3D%22_blank%22%20rel%3D%22noopener%20noreferrer%22%3EJMP%20Public%3C%2FA%3E.%3C%2FFONT%3E%3C%2FH1%3E%0A%3CH3%20id%3D%22toc-hId-639683113%22%20id%3D%22toc-hId-639683268%22%20id%3D%22toc-hId-639683268%22%20id%3D%22toc-hId-639683268%22%20id%3D%22toc-hId-639683268%22%3ESummary%3C%2FH3%3E%0A%3CP%3EThe%20Basic%20Linkage%20Mapping%20Workflow%20performs%20several%20useful%20analyses%20using%20recombination%20frequencies%20to%20place%20markers%20into%20linkage%20groups%2C%20calculate%20their%20segregation%20ratios%2C%20and%20display%20linkage%20maps.%20In%20this%20example%2C%20we%20began%20with%20marker%20data%20and%20a%20framework%20map%20which%20assigned%20certain%20markers%20to%20predetermined%20framework%20groups.%20Note%20that%20the%20framework%20map%2C%20as%20well%20as%20annotation%20data%2C%20are%20not%20required%20to%20run%20the%20linkage%20mapping%20workflow.%20Now%20that%20each%20marker%20has%20been%20placed%20into%20a%20linkage%20group%20and%20the%20distances%20between%20each%20marker%20has%20been%20estimated%2C%20QTL%20analysis%20can%20be%20performed.%20For%20information%20on%20that%20process%20see%20the%20post%20titled%20%3CEM%3E%3CA%20href%3D%22http%3A%2F%2Fcommunity.jmp.com%2Ft5%2Fx%2Fx%2Fm-p%2F211995%22%20target%3D%22_blank%22%3EGenetic%20Association%20with%20JMP%20Genomics%2C%20Part%205%3A%20QTL%20Single%20Marker%20Analysis%3C%2FA%3E.%3C%2FEM%3E%3C%2FP%3E%3C%2FLINGO-BODY%3E%3CLINGO-TEASER%20id%3D%22lingo-teaser-211949%22%20slang%3D%22en-US%22%3E%3CP%3EThe%20Basic%20Linkage%20Mapping%20Workflow%20in%20%3CA%20href%3D%22https%3A%2F%2Fwww.jmp.com%2Fen_us%2Fsoftware%2Fgenomics-data-analysis-software.html%3Futm_campaign%3Dtd7011O000002OuZY%26amp%3Butm_source%3Djmpercable%26amp%3Butm_medium%3Dsocial%22%20target%3D%22_blank%22%20rel%3D%22noopener%20noreferrer%22%3EJMP%20Genomics%3C%2FA%3E%20creates%20linkage%20maps%20using%20genetic%20marker%20data.%20The%20workflow%20includes%20output%20from%20the%20%3CSTRONG%3ERecombination%20and%20Linkage%20Groups%2C%20Linkage%20Map%20Order%2C%20%3C%2FSTRONG%3Eand%20%3CSTRONG%3ELinkage%20Map%20Viewer%3C%2FSTRONG%3E.%20This%20includes%20calculation%20of%20recombination%20frequencies%2C%20testing%20for%20segregation%20distortion%2C%20assigning%20linkage%20groups%20to%20sets%20of%20markers%2C%20generating%20visualized%20linkage%20maps%2C%20and%20reordering%20the%20data%20according%20to%20the%20linkage%20map%20for%20QTL%20analysis.%20This%20example%20will%20use%20oat%20data%20with%20around%20450%20genetic%20markers%20from%2090%20recombinant%20inbred%20oat%20lines.%3CSPAN%20class%3D%22lia-inline-image-display-wrapper%20lia-image-align-center%22%20image-alt%3D%22Genetic4.png%22%20style%3D%22width%3A%20400px%3B%22%3E%3CSPAN%20class%3D%22lia-inline-image-display-wrapper%22%20image-alt%3D%22Genetic4.png%22%20style%3D%22width%3A%20400px%3B%22%3E%3CSPAN%20class%3D%22lia-inline-image-display-wrapper%22%20image-alt%3D%22Genetic4.png%22%20style%3D%22width%3A%20400px%3B%22%3E%3CSPAN%20class%3D%22lia-inline-image-display-wrapper%22%20image-alt%3D%22Genetic4.png%22%20style%3D%22width%3A%20400px%3B%22%3E%3Cspan%20class%3D%22lia-inline-image-display-wrapper%22%20image-alt%3D%22Genetic4.png%22%20style%3D%22width%3A%20400px%3B%22%3E%3Cimg%20src%3D%22https%3A%2F%2Fcommunity.jmp.com%2Ft5%2Fimage%2Fserverpage%2Fimage-id%2F17584iA833CD59FBE5AE26%2Fimage-size%2Fmedium%3Fv%3Dv2%26amp%3Bpx%3D400%22%20role%3D%22button%22%20title%3D%22Genetic4.png%22%20alt%3D%22Genetic4.png%22%20%2F%3E%3C%2Fspan%3E%3C%2FSPAN%3E%3C%2FSPAN%3E%3C%2FSPAN%3E%3C%2FSPAN%3E%3C%2FP%3E%0A%3CP%3E%26nbsp%3B%3C%2FP%3E%3C%2FLINGO-TEASER%3E
Choose Language Hide Translation Bar
dagenu
Level V
Genetic Association with JMP Genomics, Part 4: Basic Linkage Mapping

The Basic Linkage Mapping Workflow in JMP Genomics creates linkage maps using genetic marker data. The workflow includes output from the Recombination and Linkage Groups, Linkage Map Order, and Linkage Map Viewer. This includes calculation of recombination frequencies, testing for segregation distortion, assigning linkage groups to sets of markers, generating visualized linkage maps, and reordering the data according to the linkage map for QTL analysis. This example will use oat data with around 450 genetic markers from 90 recombinant inbred oat lines.

  1. From the Genomics Starter window, select Workflows > Basic > Basic Linkage Mapping Workflow to open the dialogue box.
  2. In the General tab, select po_ingenotypes.sas7bdat as the Input Genotype SAS Data Set.
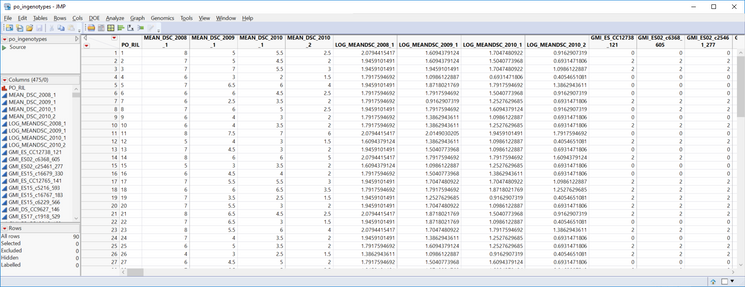
    • Inspect the data, each marker is a column, starting on column 10. Note that the genotypes are numerically coded with 0 representing a homozygous genotype for the major allele and 2 representing a homozygous genotype for the minor allele. For more information on numerically coded genotypes see Genetic Association with JMP Genomics, Part 1: Importing and Cleaning Data1_LM_geno_data.png


  3. Type “GMI:” into the List-Style Specification of Marker Variables field to specify every variable beginning with “GMI” as a marker variable.
  4. Select an Output Folder.2_LM_general.png
  5. In the Options tab, select Numeric Genotypes as the Format of Marker Variables.3_LM_Options.png
  6. The Annotation tab does not require input in this example and is always optional. For data with separate annotation data sets, they can be entered here.
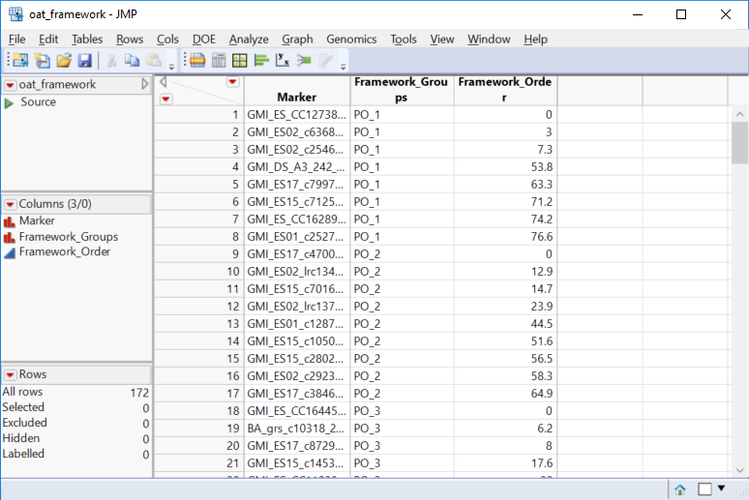
  7. The Framework Map tab is also optional. This tab is used if there are pre-defined linkage groups for a set of markers. In this case, enter oat_framework.sas7bdat as the Framework Map Data Set.
    • Open the data set and notice that 172 of the markers are already sorted into 22 known framework groups. Each marker is ordered within its corresponding framework group.4_LM_framework_data.png
  8. Select Marker as the Framework Marker Name Variable, Framework_Groups as the Framework Linkage Group Variable, and Framework_Order as the Framework Order Variable.5_LM_FrameMap.png
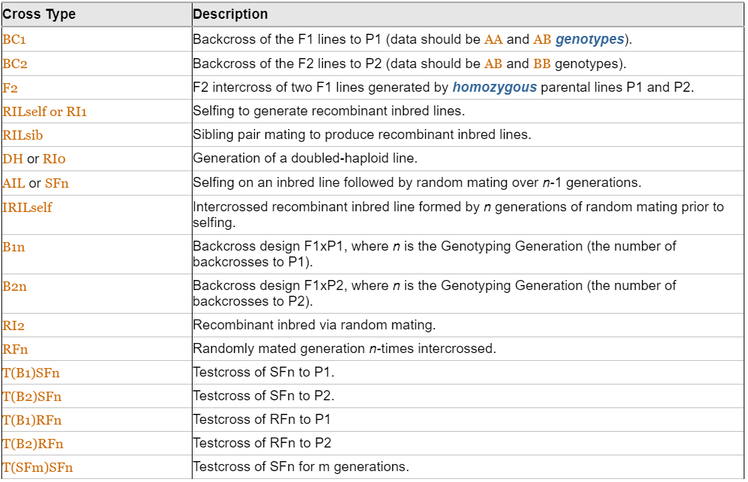
  9. In the Linkage Groups tab, Select IRILself as the Cross Type.
    • This experimental population is an intercrossed recombinant inbred line. A list of cross types and their descriptions is shown in the table below.6_LM_Cross_Types.png
  10. For the number of Random Mating Generations Prior to Inbreeding, enter 2. This is the number of generations of random mating that occurred between the initial cross and the start of inbreeding.
  11. If the experimental cross has unique expected segregation ratios, they can be specified in the Expected Segregation Ratios The expected ratios for an RIL self cross like the one in this population is 0.5 : 0 : 0.5  -- which is the default if no other values are entered.
  12. Select FDR as the Multiple Testing Method for Segregation Tests. This minimizes the False Discovery Rate.
  13. Set the Grouping Recombination Fraction Threshold to 25. This will be the maximum recombination fraction for assigning a marker to a linkage group. The lower this number, the greater amount of linkage that needs to occur for markers to be placed within the same group.7_LM_LinkGroup.png
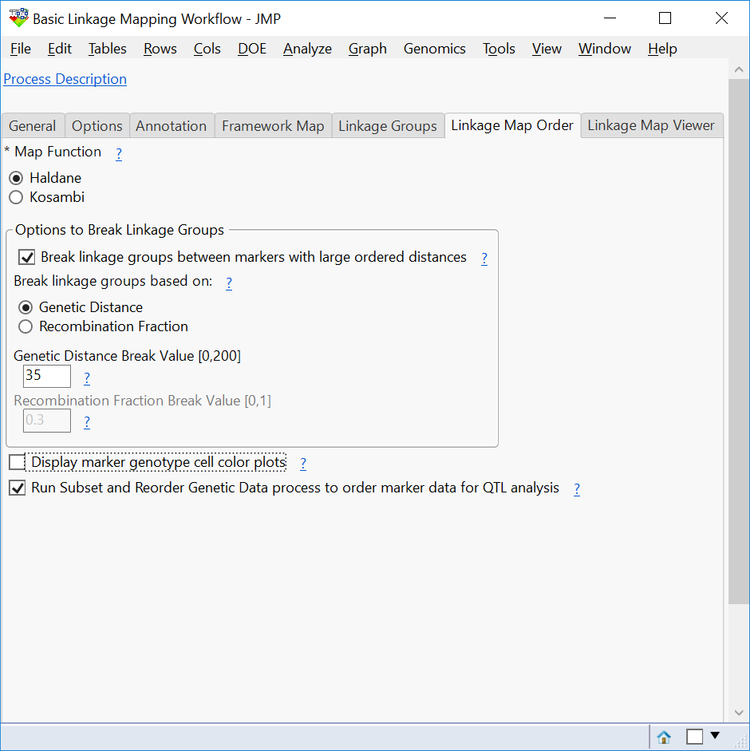
  14. On the Linkage Map Order tab, select Haldane as the Map Function. These are different methods for converting recombination fractions into distance in centimorgans (cM).
  15. Check the box to Break linkage groups between markers with large ordered distances. Break the groups up by Genetic Distance and set that Genetic Distance Break Value to 40. This means that if the distance between two markers in a linkage group exceeds 40, that group will be broken into more than one linkage group.
  16. Deselect the box next to Display marker genotype cell color plots. This creates cell plots with each genotype represented for every marker. It is not necessary here and increases computing time.
  17. Check the box next to Run Subset and Reorder Genetic Data process to order marker data for QTL analysis to reorder the data according to its linkage groups.
    • The resulting data set will be handy later in performing QTL Analysis.8_LM_LinkMapOrder.png
  18. The Linkage Map Viewer tab allows for changes in the color scheme and output layout for the 3D chromosome linkage maps. Leave the default options here.
  19. Select Run to begin the analysis. When the analysis is finished running, the following JMP Journal will appear.LM_Journal.png

Results

  1. Click the first results button, Recombination and Linkage Groups.
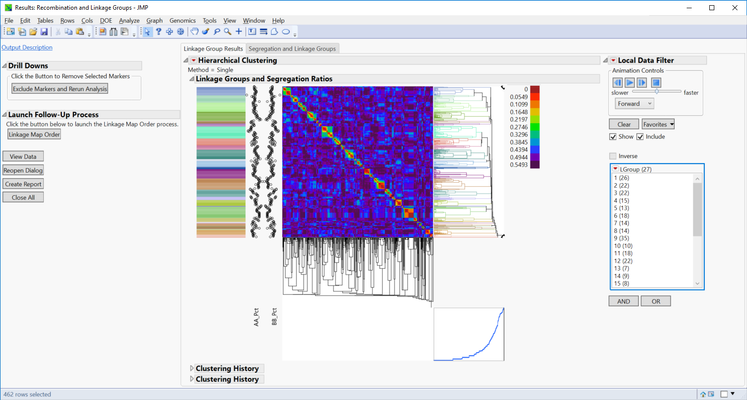
  2. The first output to appear is the heatmap of the Linkage Group Results. Red blocks in the heatmap represent very low recombination frequencies and thus highly linked markers. Each linkage group (27) is listed to the right of the window under LGroup with the number of markers in each group shown in parentheses. Click on any of the linkage groups in this list to display a heatmap for only that group.
  3. The dotplot to the left of the heatmap represents genotype frequencies. When the dots are closer together a homozygous major genotype is more frequent, and when the dots are far apart a homozygous minor genotype is more frequent.9_Heatmap.png
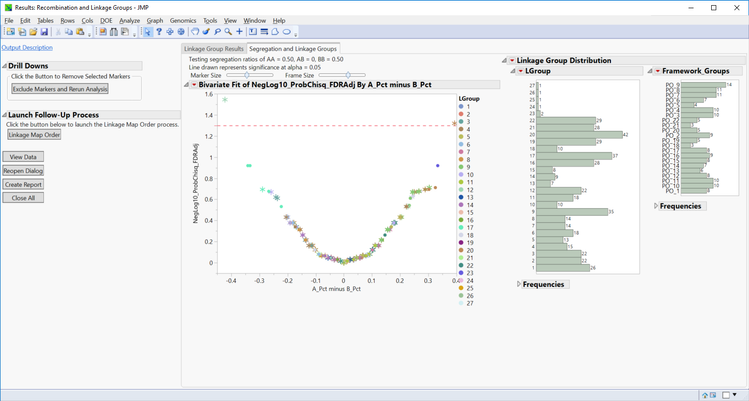
  4. The Segregation and Linkage Groups tab shows a plot of the segregation ratios for each of the linkage groups (created using recombination frequencies) and framework groups (specified in the framework map data set). The linkage groups are represented on the plot with dots, and the framework groups with stars. Note that many of these groups coincide with one another. The dotted red line represents statistical significance for the points found above it. Click any of the framework or linkage groups to highlight them in the plot.10_LinkGroup_Seg.png
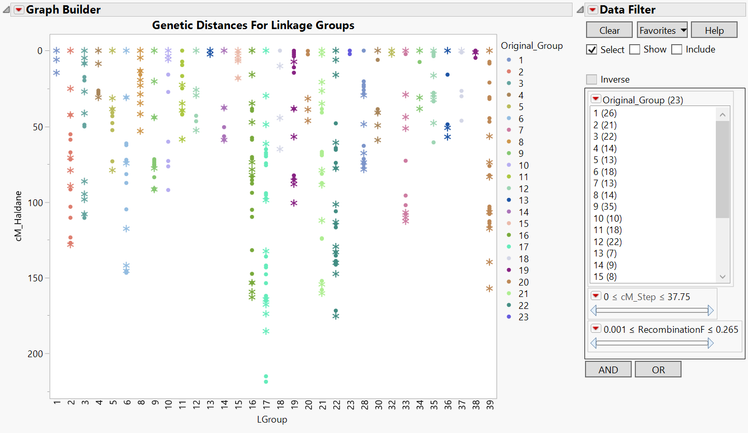
  5. Return to the JMP Journal and select Linkage Map Order. The resulting output is a plot of the genetic distances in cM of the markers in each linkage group. The markers are colored according to their original framework group, and the x-axis has each linkage group. There are now 37 linkage groups as opposed to the original framework map. This is due to the splitting of groups with markers greater than 40 cM apart.11_LinkMapOrder.png
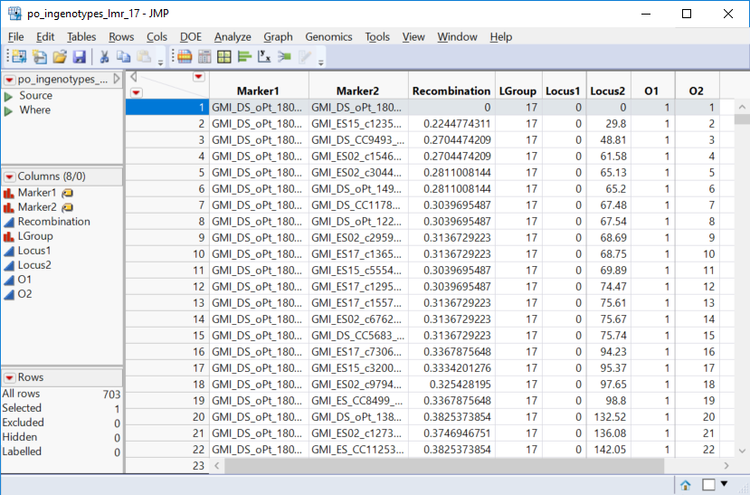
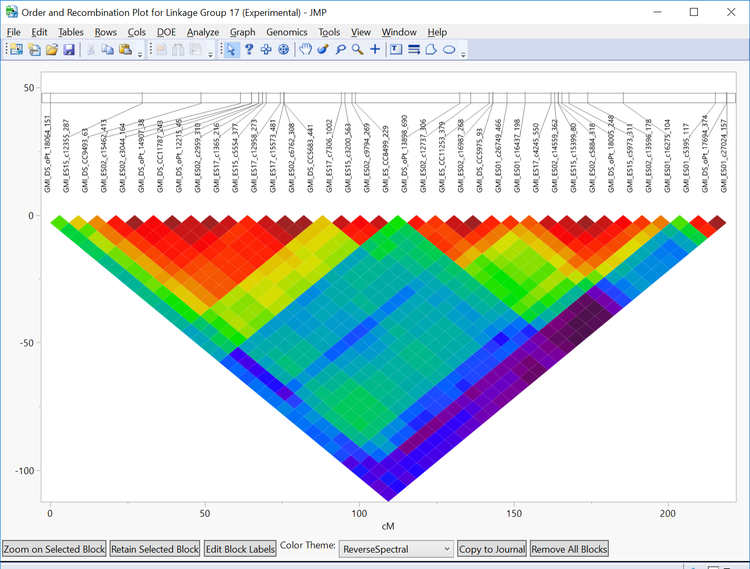
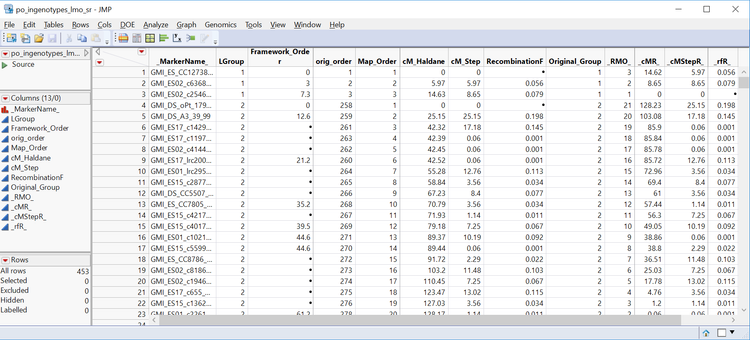
  6. In the Drill Downs menu on the left of the output window, each of the individual linkage groups can be selected for further inspection. Select Linkage Group 17. New windows will open showing a heatmap of each marker in that linkage group and its recombination frequency as well as a dataset with the recombination frequencies between each marker in the group. Each marker’s place in the linkage group can be seen on the horizontal linkage map above the heatmap.12a_recombPlot_LGroup17_data.png12b_recombPlot_LGroup17.png


  1. Next, return to the JMP Journal and select the Linkage Map Viewer. The 3D Linkage Map output will appear in a new window. This output gives a visualization of each linkage group, with positions annotated on the left and marker names on the right. The sliders at the top of the window adjust the aesthetics of the maps. Below is the map of linkage group 2.13_LinkMap_3D_Chrom2.png
  2. The last output from the JMP Journal is the Subset and Reorder Genetic Data, which are both a genotype (po_ingenotypes.sas7bdat) and an annotation (po_ingenotypes_lmo_sr.sas7bdat) data set that can be used for QTL analysis. These data sets will be saved to the Output Folder designated in the General tab. Below is the annotation set with 453 markers and linkage data for each.14output_subsetanno.png

*The interactive reports generated from this workflow can be viewed on JMP Public.

Summary

The Basic Linkage Mapping Workflow performs several useful analyses using recombination frequencies to place markers into linkage groups, calculate their segregation ratios, and display linkage maps. In this example, we began with marker data and a framework map which assigned certain markers to predetermined framework groups. Note that the framework map, as well as annotation data, are not required to run the linkage mapping workflow. Now that each marker has been placed into a linkage group and the distances between each marker has been estimated, QTL analysis can be performed. For information on that process see the post titled Genetic Association with JMP Genomics, Part 5: QTL Single Marker Analysis.

Last Modified: Jun 18, 2019 4:01 PM