JMPer Cable
A technical blog for JMP users of all levels, full of how-to's, tips and tricks, and detailed information on JMP features- JMP User Community
- :
- Blogs
- :
- JMPer Cable
- :
- Cross Evaluation and Progeny Simulation with JMP Genomics, Part 1: BLUP for Bree...
- Subscribe to RSS Feed
- Mark as New
- Mark as Read
- Bookmark
- Subscribe
- Printer Friendly Page
- Report Inappropriate Content
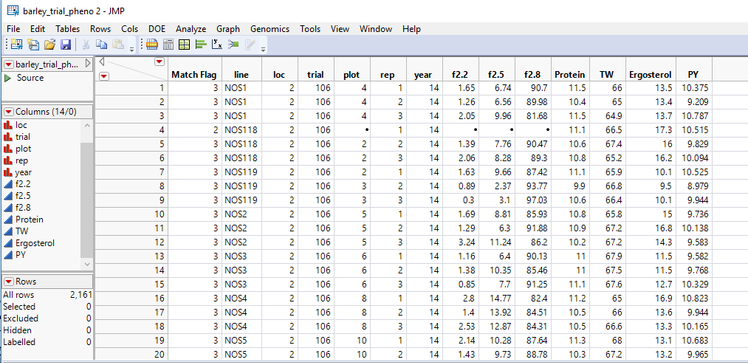
For this example, we have a set of 309 barley lines (barley_marker_data.sas7bdat), which have been genotyped for ~3,500 markers each. We also have a set of measurements (barley_trial_pheno.sas7bdat) of four phenotypes taken from field trials from two separate locations over a two-year period. The phenotypes measured are protein content, test weight, ergosterol content, and protein yield. Before evaluating crosses and simulating progeny, we must capture the effects of the multiple samples for each barley line using best linear unbiased prediction (BLUP). The BLUP removes the noise from each of the trial measurements and leave us with a single row of data for each barley line giving predictions of the phenotypic values for each trait measured.
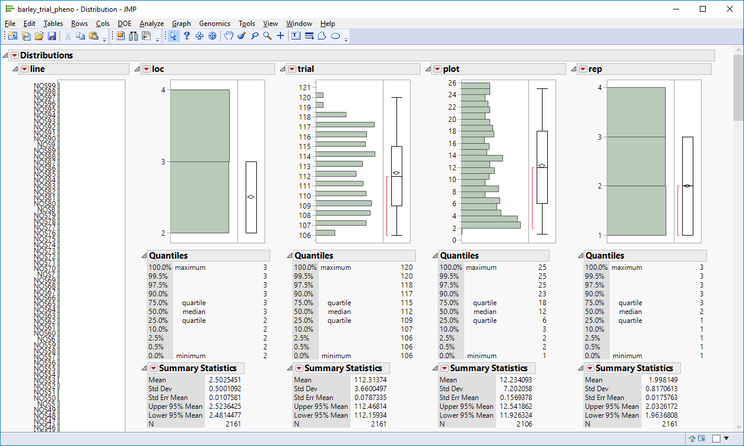
- Open the barley_trial_pheno.sas7bdat data set. This data set has 2,161 measurements taken from multiple field trials. To better understand the design of these trials, select Analyze > Distribution from the toolbar above the data table.
- Looking at the distribution of locations, trials, plots, years, and reps, we can see that that there were 15 trials consisting of 26 plots planted in two locations. We also see that most barley lines were planted in reps of three at both locations resulting in six measurements each.
- Returning to the data table, select Analyze > Fit Model from the toolbar to construct a model.
- Select the four traits: Protein, TW, Ergosterol, and PY as the Y Variables.
- To add a model effect, select a variable from the list of columns on the left and select Add in the Construct Model Effects
- First, select line as a random effect. To do this, Add line to the Model Effects box, once it is added, highlight it and select Attributes > Random Effect from menu in the Construct Model Effects
- Next, add year and loc as effects.
- To Cross effects, add the first effect, then highlight the effect in the Model Effects Select the effect to be crossed and click the Cross button in the Construct Model Effects box. To create a mixed effect for year and loc highlight year in the Model Effects box and loc from the list of columns and select Cross. The new effect will appear as year*loc.
- For nested effects, add the main effect and highlight it in the Model Effects box, then select the effect to be nested from the list of columns and click Nest. To nest year in the trial effect, add trial as a main effect, highlight it as well as year in the columns list and click Nest. The effect will appear as trial[year].
- Add each of the model effects from the screenshot below. JMP will suggest a Personality, Emphasis, and Method which can be altered from the drop-down menus. Keep the defaults for this example and uncheck the Unbound Variance Components Click Run to begin the BLUP.
- When the model is finished, a new window will appear with model fit statistics for each trait. Under each of the traits, a table can be found under the heading Random Effect Predictions giving the BLUP for each of the lines.
- To open each of these as a data table, right-click anywhere in the table and select Make into Data Table.
- NOTE: To save the model to the JMP data table that was used to create it, click the red triangle next to the Fit Group heading and select Save Script > To Data Table… This will allow the model to be saved and re-run straight from the data table.
- Perform the Make into Data Table command for the Random Effect Predictions table corresponding to each of the four traits. Each data table will open in a new window.
- When each new data table is created, make sure to name the data table and re-name the BLUP column with the proper trait (each of these tables are available in the attached files). Name the columns as follows:
- Protein Content (Protein): Protein_BLUP
- Test Weight: TW_BLUP
- Ergosterol: ERG_BLUP
- Protein Yield (PY): PY_BLUP
- When each new data table is created, make sure to name the data table and re-name the BLUP column with the proper trait (each of these tables are available in the attached files). Name the columns as follows:
- Each of the BLUP columns will need to be combined into a single data table along with the marker data for analysis. First, we will combine the phenotypic data using the Tables > Join. To begin. all four data tables must be opened in JMP. From the Protein_BLUP table, select Tables > Join. From the Join ‘Protein_BLUP’ with menu, select TW_BLUP. This will add the variables from the TW_BLUP table to the Source Columns box on the left.
- In the Source Columns box, select Term from both lists of variables and click the Match button in the Matching Specification. This will enter Term=Term in the Match Columns box indicating the variables from which the tables will be merged.
- Next, click the box next to Select columns for joined table at the bottom of the window and add the variables Term, Protein_BLUP, and TW_BLUP.
- In the Output table name box, name the table combined_BLUP and click OK to complete the merge.
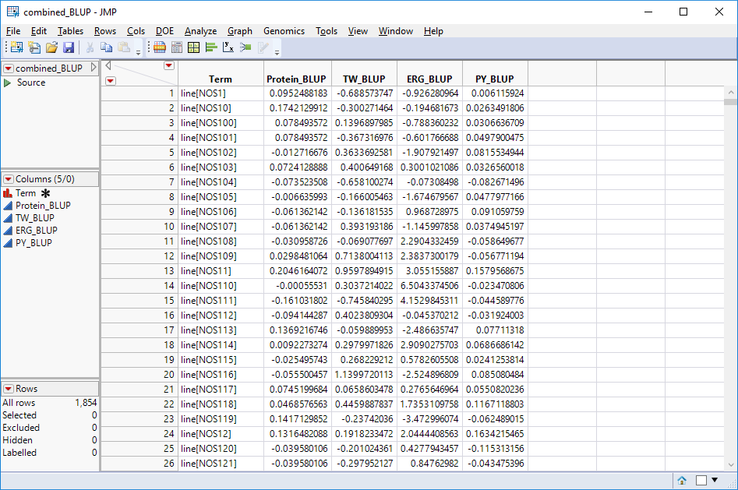
- Next, with the combined_BLUP table open, repeat the Tables > Join process to include both the BLUP columns containing the ERG_BLUP and the PY_BLUP values from their respective tables. The finished table should have five columns like the one below.
- Save the combined_BLUP table as a SAS Data Set (.sas7bdat).
- Now that the BLUP values for the four traits are combined, they can be added to the marker data, but first the Line IDs will need to be extracted from the brackets in the Term column in the combined_BLUP.sas7bdat table to match the Line IDs from the IndID column in the barley_marker_data.sas7bdat table. This can be done using the Formula options in JMP. First, right-click the column header row and select New Columns… In the new dialog box, name the column “LineID”.
- Once the LineID column is created right-click it and select Formula…
- In the list on the far left of the Formula window, select Character > Word. To create a formula that will extract the line names from the bracket, double-click over the “Word” portion of the formula in the middle of the screen and enter Word(2, Term, "[]"). Click OK to apply the formula to the new column.
- Now, using the matching columns, the marker data and phenotypic data can be merged into a single table that is ready for analysis in JMP. Begin with the combined_BLUP.sas7bdat table open and again select Tables > Join from the toolbar.
- In the new window, Match the Line_ID column from the combined_BLUP table with the Ind_ID column from the barley_marker_data
- In the Matching Specification box, check the Drop Multiples box for the Main Table and the Include non-matches box for the With Table. This will drop the extra BLUP data and only include the lines with marker data present.
- Enter barley_geno_pheno as the Output table name and click OK to merge the tables.
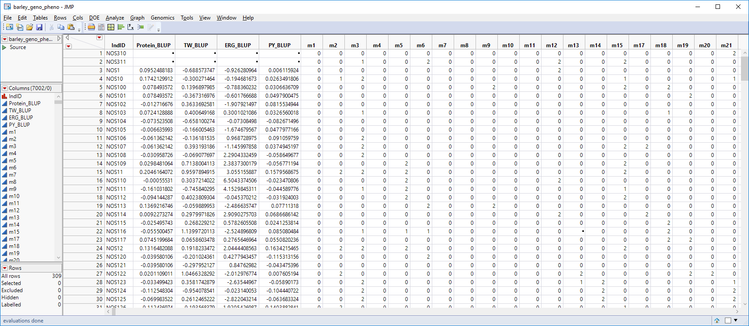
- The completed table has all of the marker data merged in with the BLUP data. Optionally, right-click any unwanted columns to remove them (Term, LineID) and move the IndID column to the left-most column in the table by dragging it to the top of the list of columns in the Columns box to the left of the table. Save the table as barley_geno_pheno.sas7bdat.
Summary
Before beginning the cross evaluation and progeny simulation process, a BLUP must be created to capture a single phenotypic value for each line of barley. In this post, we created a mixed-model to get BLUPs of each barley line, combined the BLUP values for each trait, and merged in the genotypic data. Now the SNP data and the phenotypic data are combined in a single data set. In the next post (Cross Evaluation and Progeny Simulation With JMP Genomics Part 2: Predictive Modeling Review for Breeding Values), we create and compare models through cross validation, which will predict the breeding values of crosses from these lines.
- © 2026 JMP Statistical Discovery LLC. All Rights Reserved.
- Terms of Use
- Privacy Statement
- Contact Us


You must be a registered user to add a comment. If you've already registered, sign in. Otherwise, register and sign in.