Control charts provide feedback on key variables and show when a process is in, or out of, statistical control. In JMP, scientists and engineers construct these charts using an interactive control chart platform called Control Chart Builder. In JMP 16, when control charts are published to JMP Live and have warnings, interested parties can automatically be notified so they can appropriately triage and act upon issues as they arise – all from the convenience of any device with a web browser.
Statistical process control engineers often are tasked with monitoring hundreds or thousands of processes daily. With JMP, there are tools and techniques that let these engineers separate the trivial many processes that are running fine from the vital few that need appropriate triage, follow-up and action.
JMP Live fits naturally into the workflow of a statistical process control engineer and can now receive notifications of warnings on JMP Live control chart posts.
When a JMP Live control chart post is published, republished or regenerated (for example, after a data update), JMP tells JMP Live about any control chart warnings. JMP Live then stores these warnings and sends out notifications to users who care about them.
JMP Live considers "users who care about them" to be the publisher of the post, as well as all members of any group the post is shared with, if that group has the Enable Warnings option turned on.
There are 15 possible warning types, and you can turn testing for these 15 types on or off by right-clicking a chart in JMP. The warnings that you might care about monitoring vary by industry and process.
Let’s see how this works. I am using the Washers sample data set available from the sample data library. I run the “P Chart: Control Chart Builder” script in the data table. In order to test for warnings and share them with interested parties when I publish to JMP Live, I need to enable the Tests. From the red triangle menu, I click the control panel and then turn on Test 1.
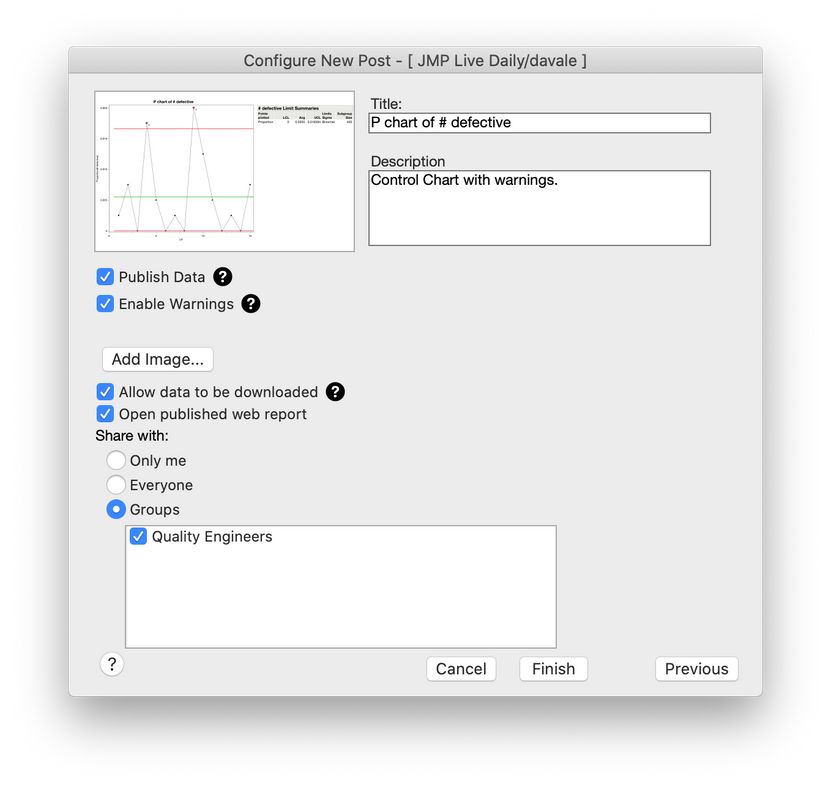
 I now have a chart with a couple of warnings. To publish this to JMP Live, I’ll use File -> Publish. On the Configure New Post screen, there are a couple of new options in JMP 16. The first is a checkbox to enable warnings. If the post you are creating is able to send warnings, the option will show up. I’m going to share this with a Quality Engineers group I am part of to make sure that my interested parties will be notified.

I just published this chart to. As you can see, this group has w so that if a chart has any warnings, all interested parties will be notified in their alerts when they log into JMP Live and . Also, Enable Warnings is not on by default when setting up a group. You must click on the Enable Warnings option from the group menu.
 This is the card view of the post I just published. A red line on the top of the post as well as the warning indicates that this control chart indeed has warnings that need to be appropriately dealt with.

From within a group, you can see that the control chart has a warning from a red bar in the card, the warning indicator and also a system-wide notification.
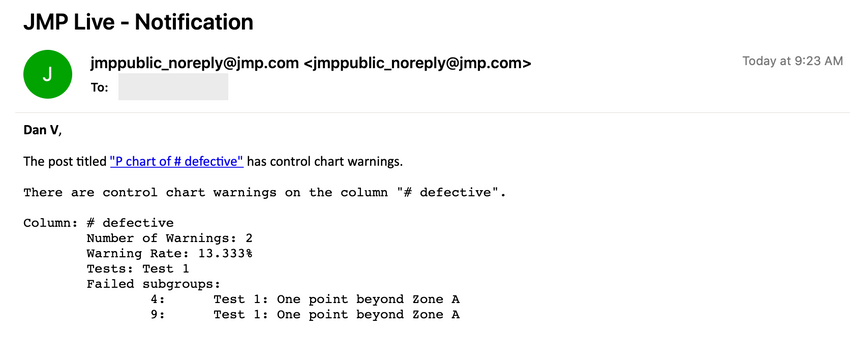
All interested parties will have also received an email with a direct link to the post and information about what tests were performed, which warnings were triggered and a description of the failed subgroups, tests failed and a reminder of what the test means.
While most comments on a post are made by JMP Live users, the JMP Live system itself can also make comments on a post. When the post has warnings enabled, these comments will include a brief note about which columns have control chart warnings.

And just like other workflows in JMP Live, the publishing of these control charts can be automated through scripting and scheduled for regular update as new data comes in. The Control Chart Builder can also be part of a larger process screening workflow, which I describe in an earlier blog post.