Dennis Lendrem explains why design of experiments is essential for discovery
Dennis Lendrem’s LinkedIn newsletter, Apes in Lab Coats, has spawned two books.

The new Subgroup role in Response Screening and the Response Screening personality of Fit Model make it easy to explore endpoints within subgroups of observations.
Since its launch in October 2024, the JMP Marketplace has served as a central hub for secure, quality-controlled JMP extensions. To offer you the best possible experience, we're streamlining our platforms and phasing out the File Exchange.
The forthcoming Dynamic Survival report for JMP Clinical 19 provides a more informative and interactive experience for summarizing time-to-event endpoints from the ADTTE ADaM domain.
"I’m not tech savvy. I just don’t get math. It’s like a foreign language. I can’t do this." - Kirsten Boyd, Newburyport High School
Do you use JMP and Python? Are you using them independently? Are you using Python for some things and JMP for other things? Did you know that there are many ways they work together? This blog series focuses on highlighting a few ways that JMP and Python work together when tackling a problem. We want you to be aware of these synergies so that you can use both tools together effectively to solve big...
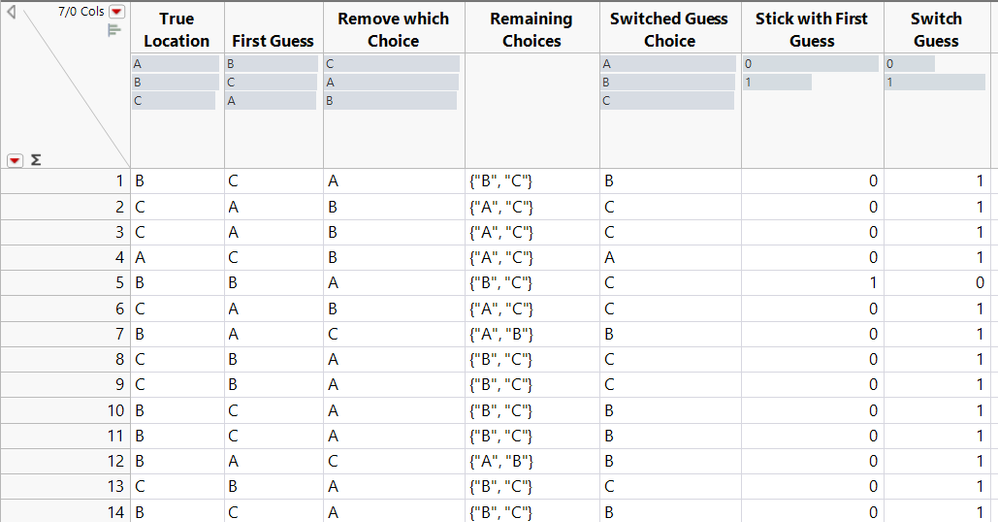
The Monty Hall problem is a fun and seemingly paradoxical thought experiment that has confounded many smart people. It happens to be fairly straightforward to solve using JMP, and it presents an opportunity to learn a little about column formulas at the same time. Read on to learn more.
A compelling component of presenting research is graphs of data collected and the story those visualizations tell. The Graphs for the Experimenter add-in helps JMP users in the life sciences create visualizations in Graph Builder. The add-in offers templates for commonly used analyses and gives researchers a start with using graphs to explore data and share discoveries. Watch the video below to ...
The forthcoming Co-occurrence report in JMP Clinical 19 enables users to explore all pairs of occurrences that happen simultaneously within a patient overlapping in time.
The forthcoming Nearby Occurrences report enables users to define reference occurrences of interest and find nearby occurrences that appear within time windows around start or stop dates, as well as those nearby occurrences that may have any overlap in time between reference and nearby occurrences.
Richard summarizes all the ways in which JMP Clinical provides greater insight into the safety of novel treatments by reviewing the reports available for adverse events.
在智慧製造與精益轉型的浪潮下,產品與系統的「可靠度」早已不再是傳統的品質管控指標,而是影響客戶滿意度、品牌信任與運營效率的核心競爭力。從消費電子、汽車零部件,到工業設備與半導體產品,可靠度分析正快速成為工程團隊不可或缺的關鍵能力。 可靠度是指產品在特定時間和使用條件下無故障運行的能力。從資料分析的角度出發,我們通常會通過「壽命分佈模型」來描述產品的失效時間分佈,其中最常見的是 Weibull分佈,它可以精準描繪不同時間點的失效率與風險函數。
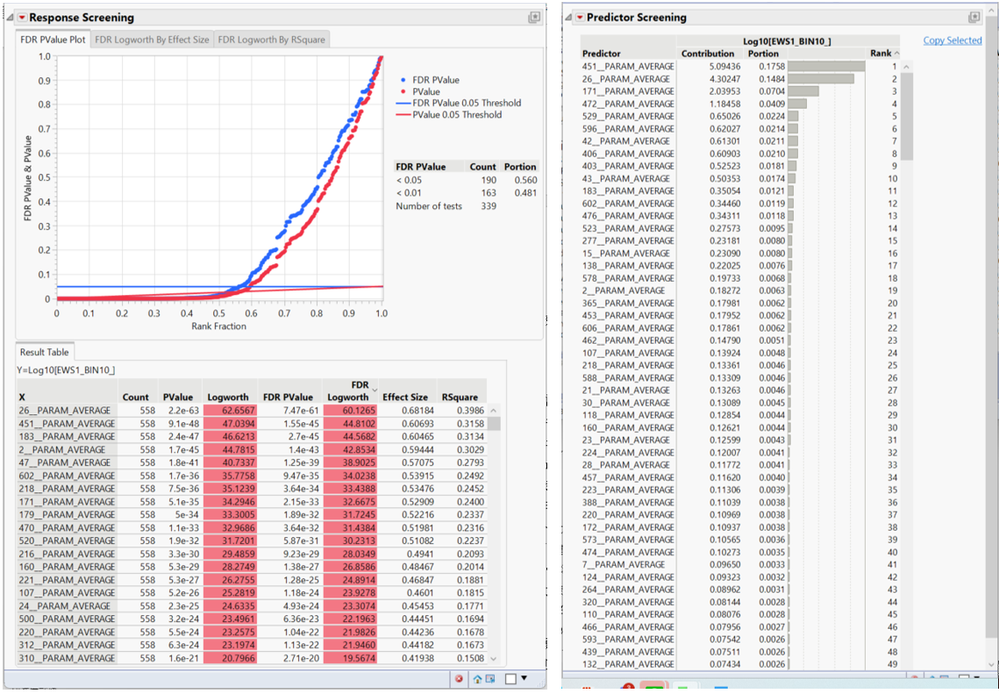
在半導體產業的工作生態中,常常需要對面對的不良狀況找出問題來源,迅速地導入改善對策,而其中最為困難的階段是如何快速地從動輒上百上千的參數中,尋找出最相關的影響因子。以往,可能只能依靠工程師的過往經驗,慢慢的對懷疑的參數試錯找出關鍵因子,這樣的方式不僅耗時曠日,也可能忽略其中重要的指標。如何快速找到製程可以優化的方向,絕對是每一個工程團隊所面臨的一大挑戰。
Learn about how JMP users from notable organizations explore data and overcome obstacles. See and read presentations from over 55 JMP Discovery Summits.
The Moderation and Mediation Add-In for JMP Pro makes it easy to use methodologies that are popular amongst social scientists (like me!). But these methodologies can be useful in other settings, too. In this blog post, I’ll demonstrate how to use the add-in while modeling chemical purity as a function of catalyst concentration and temperature.
Automatiza tu trabajo y mejora tu productividad con JMP
JMP es mucho más que solo un software de análisis estadísticos – se incluyen recursos para aprender y una comunidad de usuarios expertos para apoyar con dudas. Para personas que están recién empezando con JMP, existe una multitud de recursos gratuitos para aprender, que ayudan acelerar la velocidad con que se aprende extraer la información valiosa de los datos. Con tantas páginas, recursos, y opci...
This blog was authored by Shuying Han. Shuying Han developed the UpSet Plot add-in as part of the Biostatistics Undergraduate Summer Internship (BUSI) program at the University of North Carolina at Chapel Hill.
Introduction
Nowadays, statistical studies and clinical trials aim to uncover and communicate the stories within data, transforming raw numbers into meaningful insights. Data visualiza...
Xueting Wang wrote this blog post. Xueting Wang developed this add-in as part of the Biostatistics Undergraduate Summer Internship (BUSI) program at the University of North Carolina at Chapel Hill. Introduction What data visualization do you use when you want to view the evidence from different studies and interpret the overall findings of a systematic review? The forest plot is a good choice...