cancel
Showing results for 
Show  only  | Search instead for 
Did you mean: 
  • Don’t miss your chance to experience Discovery Summit Europe at our best available rate! Early bird registration through 31 Oct.
  • Graph Builder Toolbar streamlines interactive graphing. Creates shortcuts on Report and GraphBuilder Helpers toolbars. Download and install the extension.
  • JMP will suspend normal business operations for our Rest and Recharge Day on Friday, October 2, 2026.
    Regular business hours will resume on Monday, October 5, 2026.

JMP Wish List

We want to hear your ideas for improving JMP. Share them here.
Choose Language Hide Translation Bar

Likelihood Intervals in Reliability Profilers

It would be great if Distribution and Quantile Profilers in the Reliability Platform optionally showed Likelihood Intervals instead of Wald Intervals.


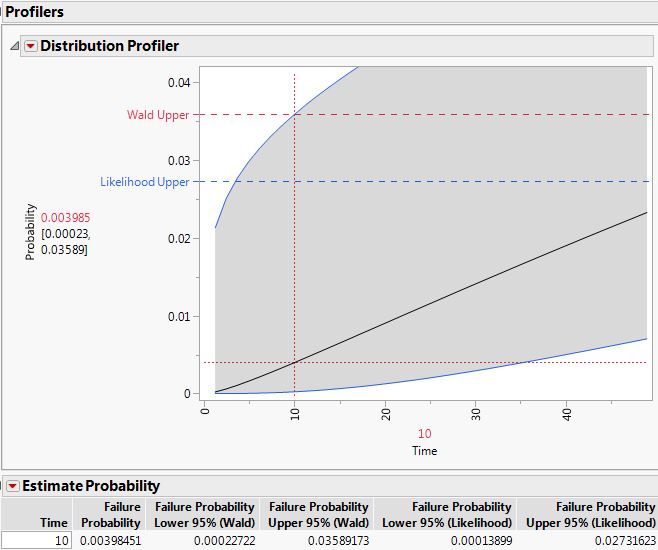
As Likelihood Intervals tend to be more precise than Wald Intervals, we prefer Likelihood Intervals in Custom Estimation. When accompanying these estimations by Distribution/Quantile Profilers, however, it can get confusing when the intervals used in graphs don't reflect the custom estimations.


Ideally, Profilers could also optionally show one-sided intervals instead of two-sided ones.


Below is an example created with the JMP Sample Locomotive Data where except for the first 5 Failes all other observations were set to "Censored".
LikelihoodIntervals_inGraph.JPG

1 Comment
Sarah-Sylvestre
Level V
Status changed to: Acknowledged

Hi @gerd, thank you for your suggestion! We have captured your request and will take it under consideration.