Hello, Would it be possible to create a simple implementation in Graph Builder or the Distribution Platform to easily plot two histograms and calucate the proportion of area shared by them under a particular distributional assumption? (eg. Normal)
https://community.jmp.com/t5/JMPer-Cable/How-to-overlay-histograms-in-JMP/bc-p/229894/highlight/true...
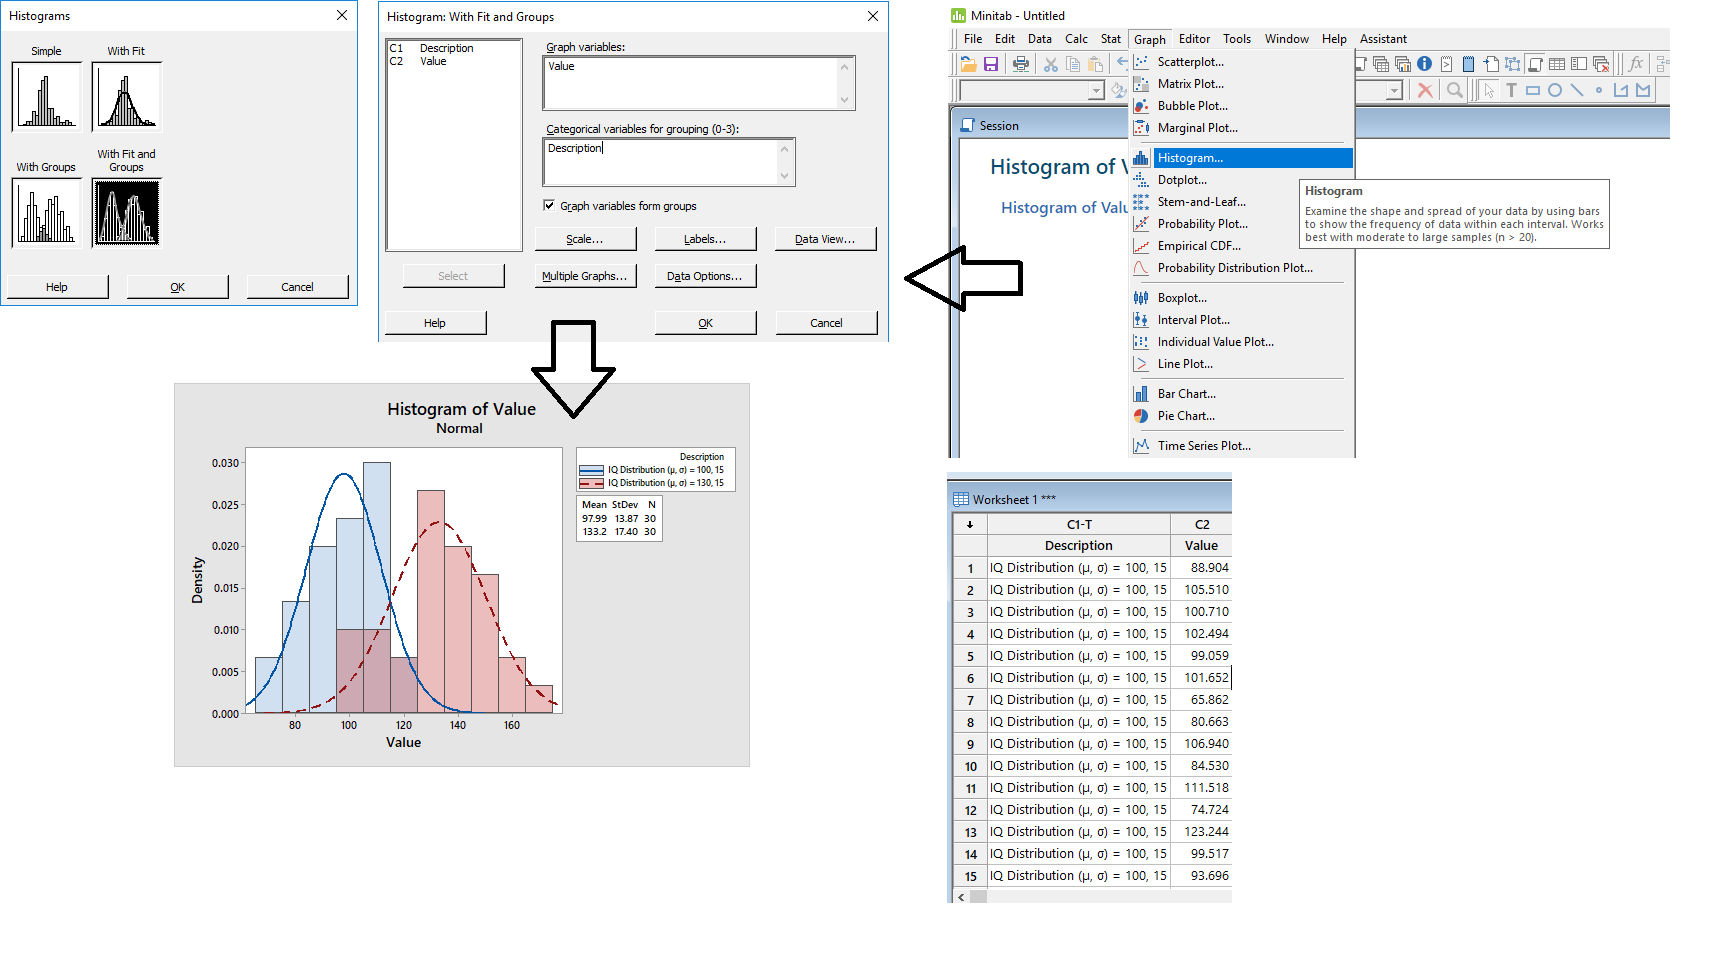
Minitab has a decent implementation of this: I copy-paste a graphic of their output here for your reference. Also the link to the above post shares the specifics on the ask in more detail per my discussions with @XanGregg and @Steven.
cheers,
@PatrickGiuliano
example overlay histograms.jmp