cancel
Showing results for 
Show  only  | Search instead for 
Did you mean: 
  • Don’t miss your chance to experience Discovery Summit Europe at our best available rate! Early bird registration through 31 Oct.
  • Graph Builder Toolbar streamlines interactive graphing. Creates shortcuts on Report and GraphBuilder Helpers toolbars. Download and install the extension.
  • JMP will suspend normal business operations for our Rest and Recharge Day on Friday, October 2, 2026.
    Regular business hours will resume on Monday, October 5, 2026.

JMP Wish List

We want to hear your ideas for improving JMP. Share them here.
Choose Language Hide Translation Bar
0 Kudos

How Do I Overlay 2 or more Histograms, Fit Normal Curves, then Automatically Compute their shared area?


Hello, Would it be possible to create a simple implementation in Graph Builder or the Distribution Platform to easily plot two histograms and calucate the proportion of area shared by them under a particular distributional assumption? (eg. Normal)


https://community.jmp.com/t5/JMPer-Cable/How-to-overlay-histograms-in-JMP/bc-p/229894/highlight/true...


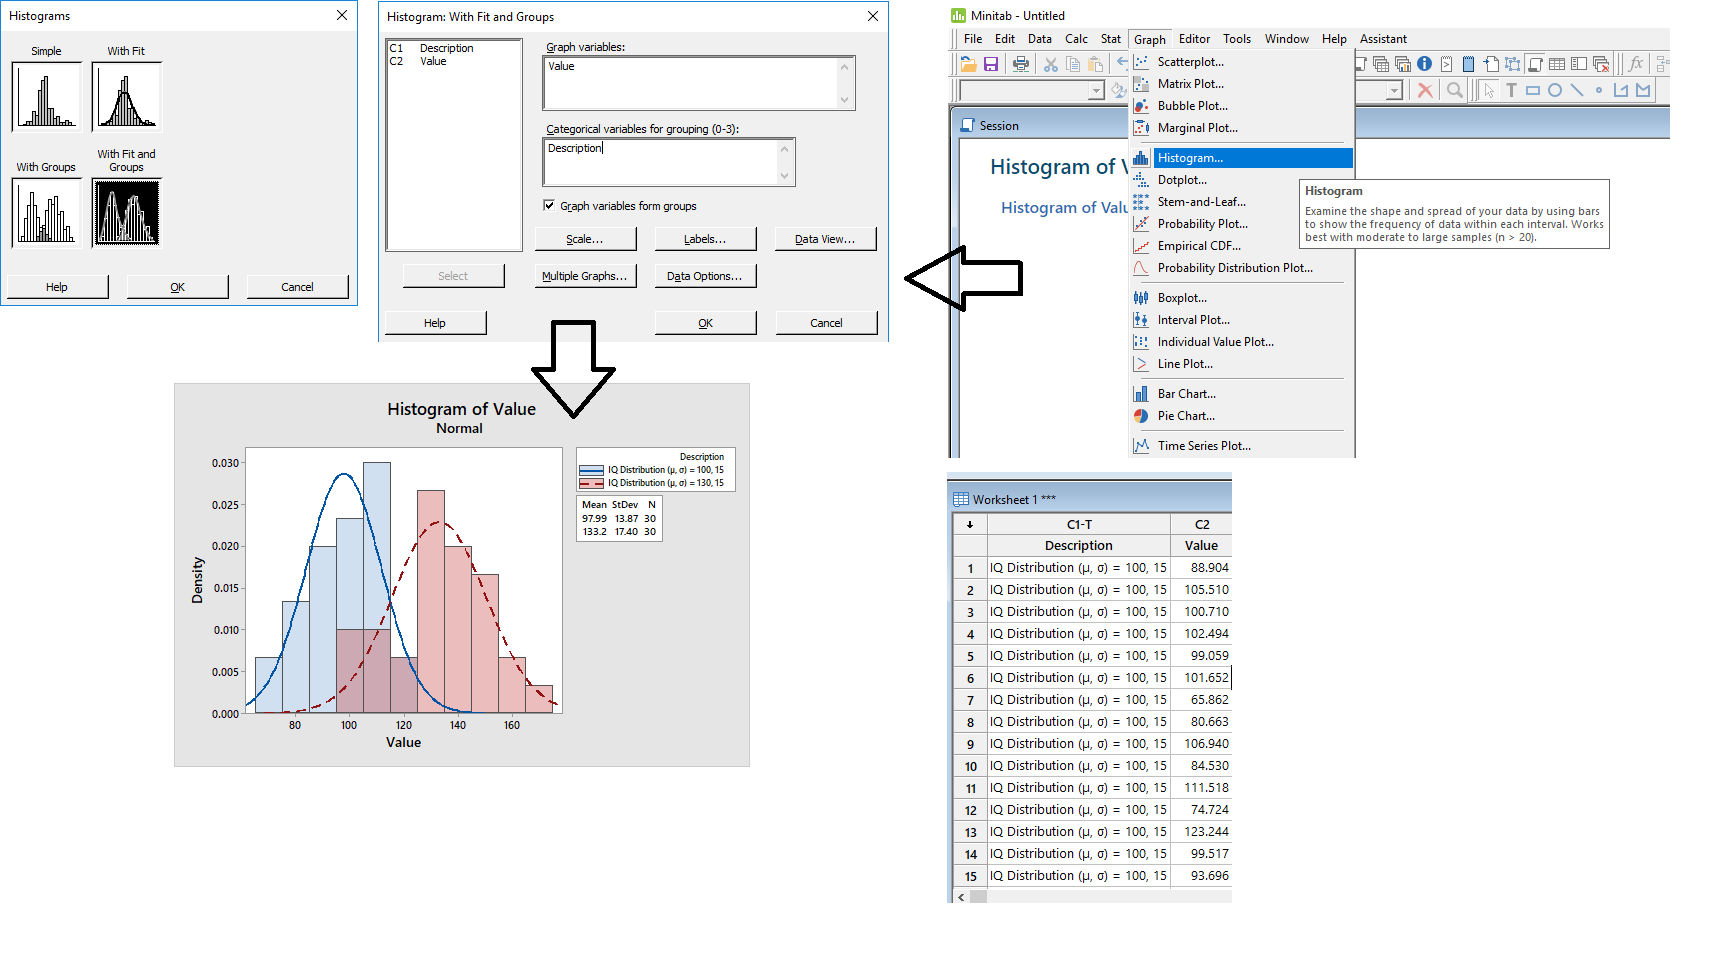
Minitab has a decent implementation of this: I copy-paste a graphic of their output here for your reference. Also the link to the above post shares the specifics on the ask in more detail per my discussions with @XanGregg and @Steven. 


cheers,

@PatrickGiuliano 

1 Comment
Ryan_Gilmore
Community Manager
Status changed to: Archived
We are archiving this request. If this is still important please comment with additional details and we will reopen. Thank you!