cancel
Showing results for 
Show  only  | Search instead for 
Did you mean: 
  • JMP Security Notice: CVE-2026-109618 and CVE-2026-109619

    JMP promptly initiated a review of its products, services, and relevant infrastructure for exposure to CVE-2026-109618 and CVE-2026-109619.

    Our assessment of JMP products has not identified exposure to these vulnerabilities. Where remediation was required within supporting environments, appropriate security updates and controls have been applied and validated.

    We have identified no evidence of successful exploitation or unauthorized access to JMP systems or customer information associated with these vulnerabilities.

    JMP continues to monitor the issue and relevant vendor guidance. No action is required by JMP customers at this time.

  • Don’t miss your chance to experience Discovery Summit Europe at our best available rate! Early bird registration through 31 Oct.
  • Graph Builder Toolbar streamlines interactive graphing. Creates shortcuts on Report and GraphBuilder Helpers toolbars. Download and install the extension.

JMP Wish List

We want to hear your ideas for improving JMP. Share them here.
Choose Language Hide Translation Bar
0 Kudos

Hide excluded regions in Graph Builder axis (batch process data, time series and sensor data with filters)

When analyzing sensor data, it is common to filter multiple rows (e.g., removing shutdowns, weekends, certain product grades in batch processes, etc.)

This is not possible to do in JMP, while other software handles this automatically (see Grafana or another user requesting a similar feature here).  Yet, the control chart builder has this functionality, limited to run charts only.


Let's say I want to look at a group of events only.
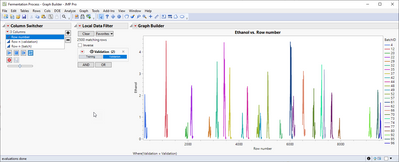
FN_0-1689256145226.png

I would expect to have an option to transform this view into this automatically.
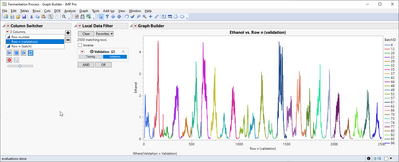
FN_1-1689256178029.png

In the control chart builder, you can get this plot after some configuration:
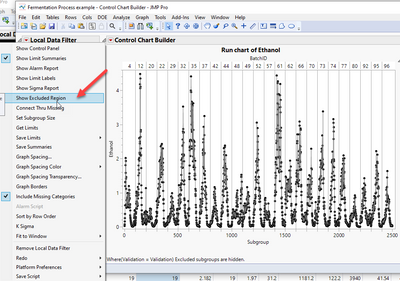
FN_4-1689256439116.png


Lastly, an index per event will be also good to have as an option.
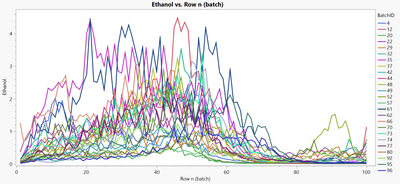
FN_3-1689256295549.png


JMP needs to improve the capabilities for sensor data (not only tabular), especially now that native connectors to historians are possible.


Industrial applications of these visualizations can be found here, including an alignment when events have different durations:
https://arxiv.org/abs/2209.09660


1 Comment
hogi
Level XIII

Index per event : via  Col Rank(row(), grouping) ?

To get a virtual row number of non-missing entries, one can combine Col Rank() with the new Scoping option in Graph Builder :

hogi_0-1762797910019.png


Names Default to Here(1);
dt = Open( "$SAMPLE_DATA/Big Class.jmp" );
Graph Builder(
	Transform Column(
		"index",
		Formula( Col Rank( row(), :"@Exclude"n, :"@Filter"n ) )
	),
	Size( 438, 290 ),
	Show Control Panel( 0 ),
	Show Legend( 0 ),
	Graph Spacing( 4 ),
	Variables( X( :index ), Y( :height ) ),
	Elements( Points( X, Y, Legend( 9 ) ), Smoother( X, Y, Legend( 10 ) ) ),
	Local Data Filter(
		Add Filter(
			columns( :age ),
			Where( :age == {13, 14, 15, 16} ),
			Display( :age, N Items( 6 ) )
		)
	)
);