cancel
Showing results for 
Show  only  | Search instead for 
Did you mean: 
  • New to JMP? Join us Sept. 23-24 for the Early User Edition of Discovery Summit, tailor-made for new users. Register now for free!
  • Use World Cup data to build models, explore spatial relationships, and create informative visualizations in JMP. Register. July 17, 2 pm US Eastern Time.
  • Your voice matters! Tell us how you prefer to receive JMP updates, so we can tailor our communication to your needs. Take short survey.

JMP Wish List

We want to hear your ideas for improving JMP. Share them here.
Choose Language Hide Translation Bar
0 Kudos

Graphbuilder: use a column numbers or letters as symbols for graph

What inspired this wish list request? I would like to be able to visualize an additional variable


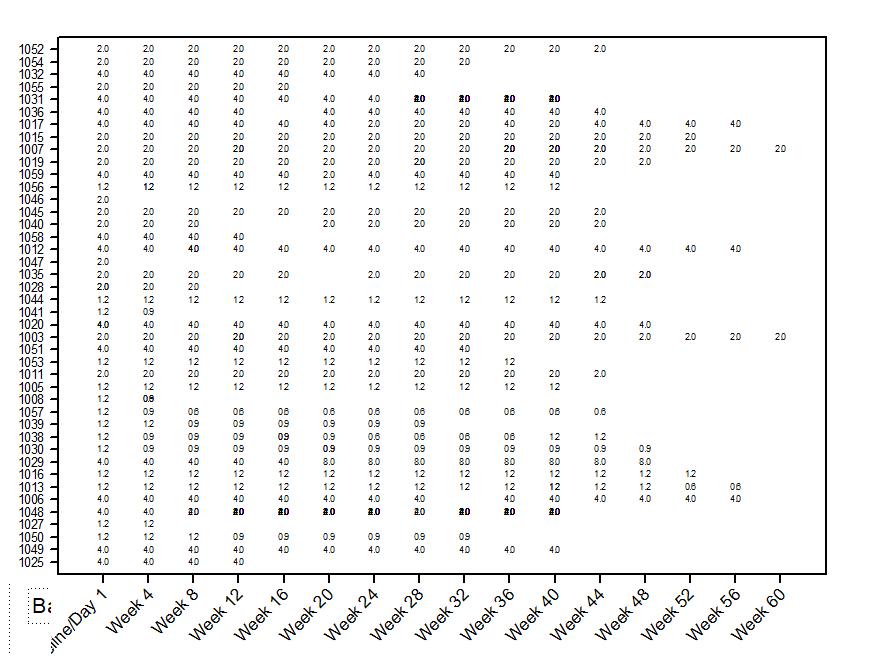
What is the improvement you would like to see? I would like to create a graph where the symbols or points can be substituted with numbers or letters from a column I select.  See example attached generated in Sigmaplot.


Why is this idea important? This allows display of additional variable without having to hover.


1 Comment
XanGregg
Staff

If I understand you correctly, I think you're describing the "Set Shape Column" feature already in Graph Builder. It's under the red triangle menu for the Points options. In this screenshot, I've already selected sex as the shape column. This was new in JMP 16. Before that, the "Use for Marker" column attribute could be used for that purpose, but it applies to all your graphs.


XanGregg_0-1678228409637.png